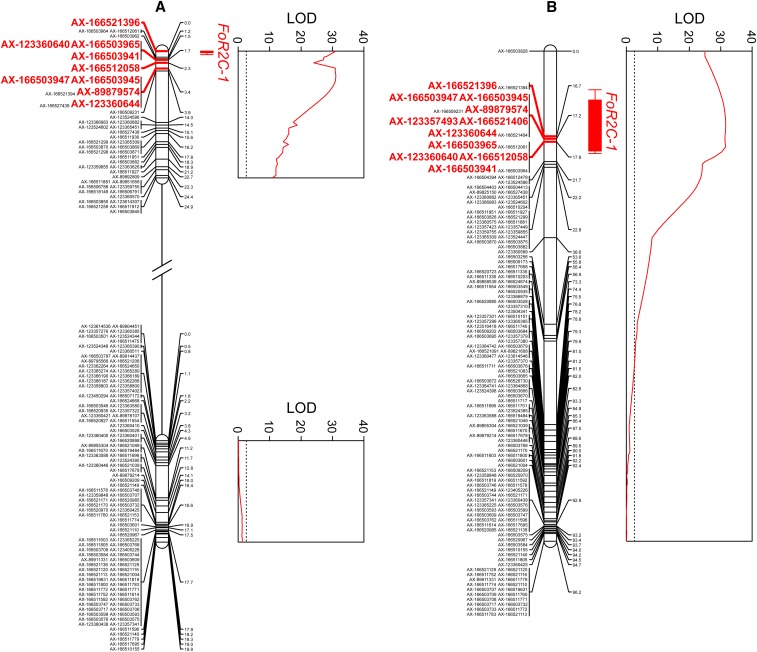
Figure 6.
Genetic mapping of a Fusarium wilt resistance gene (Fw1) in octoploid segregating populations. Likelihood-odds (LOD) statistics and linkage group positions (cM) are shown for a quantitative trait locus (QTL) for Fusarium wilt resistance identified by interval mapping in (A) Portola and (B) Fronteras S1 mapping populations. The parents (Fronteras and Portola) and grandparents (04C018P004/05C165P001 and 97C093P007/97C209P001) of the S1 populations and 93 S1 individuals from each population were genotyped with the iStraw35 SNP array and artificially inoculated with isolate AMP132 of Fusarium oxysporum f. sp. fragariae at planting. Phenotypes were observed 36 weeks post-inoculation in a 2017 field experiment in Davis, California. The Fw1 QTL mapped to identical locations on the upper arm of chromosome 2C in both populations. One- and two-LOD confidence intervals are shown. Highlighted SNPs (bold red) were significant in genome-wide association studies.

