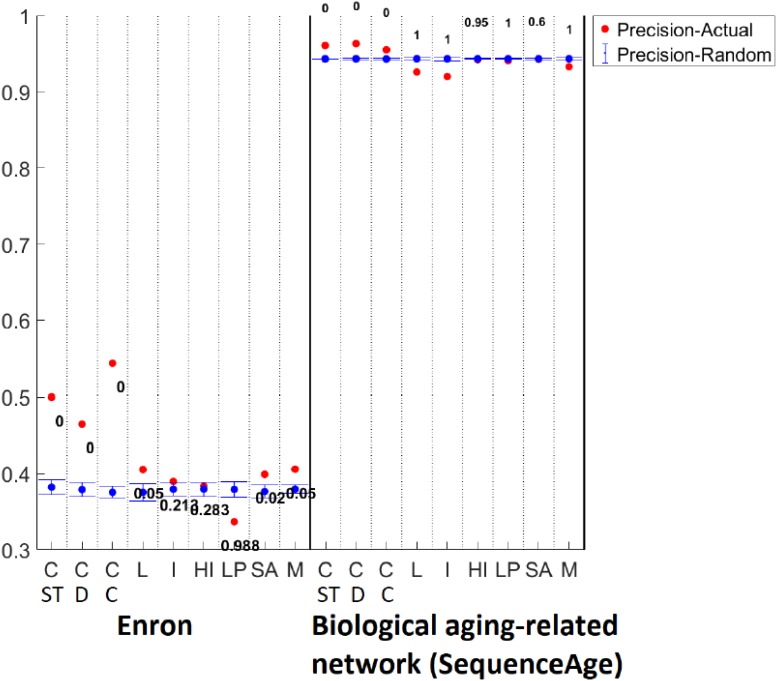
Fig 8. Detailed method comparison.
Detailed method comparison results for the social Enron (left) and biological aging-related (right) dynamic networks, quantifying the fit of each method (ClueNet (C-ST,C-D,C-C), Louvain (L), Infomap (I), Hierarchical Infomap (HI), label propagation (LP), simulated annealing (SA), and Multistep (M)) to the corresponding ground truth partition in terms of precision. There is one ground truth partition for the Enron network (results shown in the figure). There are four ground truth partitions for the aging-related networks, depending on which aging-related ground truth data is considered (BE2004, BE2008, AD, or SequenceAge; Section Data). Results are shown in this figure for the SequenceAge-based ground truth partition. For each dataset, for each method, we compare the precision score of the partition produced by the given method (red) to the average precision score of its random counterparts (blue) and show the resulting p-value (see Section Measuring partition quality for details). These are representative results for one network/ground truth partition from each of the social and biological domains and one measure of partition quality. Equivalent results for the other three biological aging-related ground truth partitions, for the other two social dynamic networks (hospital and high school), and for the other three partition quality measures (recall, F-score, and AMI) are shown in, S3, S4, S5 and S6 Figs.

