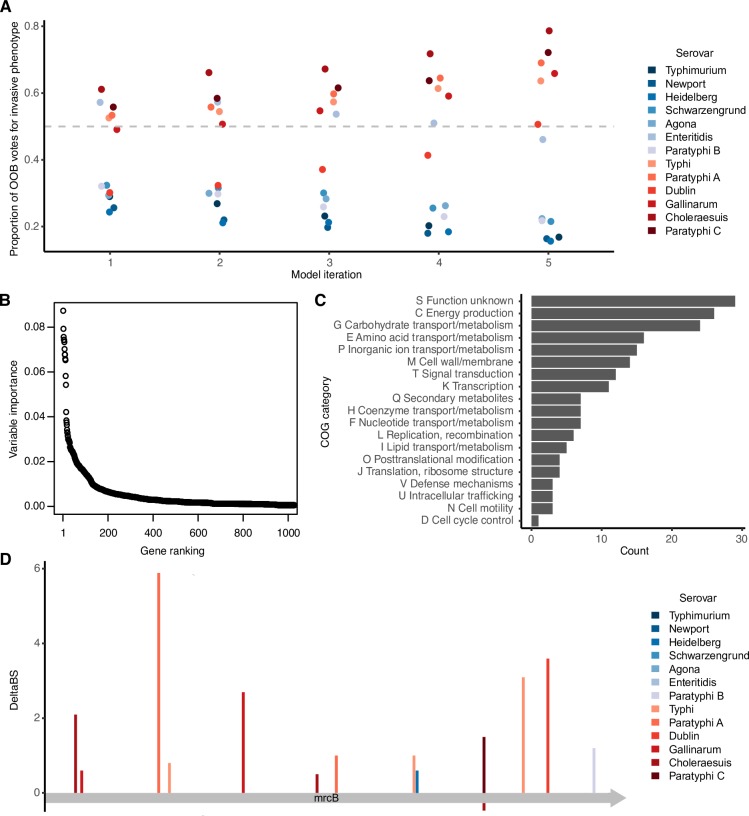
Fig 2. A subset of Salmonella genes are strongly indicative of invasive potential.
A: Out-of-bag votes for phenotype of each serovar cast by each model. Model 1 is the model built using all predictor variables, then each successive model was built using sparsity pruning from the previous model’s predictor variables. Model 5 is the final model with 100% accuracy. Out-of-bag votes include only those votes cast by trees that were not trained on a given sample. The dashed grey line indicates the voting threshold to classify an isolate as invasive. Invasive serovars are coloured in red and gastrointestinal serovars are coloured in blue. B: Of all genes used in the original training dataset, a small minority are given high importance in identifying invasive strains. Variable importance is shown for the top 1000 genes used in the original training set. Variable importance was measured as average decrease in Gini index in a random forest model trained on all orthologous groups that met the inclusion criteria (N = 6,438). C: Functional categories associated with the top predictive genes. D: Mutations in mrcB (penicillin-binding protein 1b), one of the top three predictors. Mutations in different strains are colour-coded, with bars in red indicating a mutation in an extraintestinal strain and bars in blue indicating a mutation in a gastrointestinal strain. An estimate of the effect of the mutation on protein function (DeltaBS) is shown on the y-axis, with positive values indicating higher chance of a mutation impacting protein function. The x-axis represents the length of the protein.

