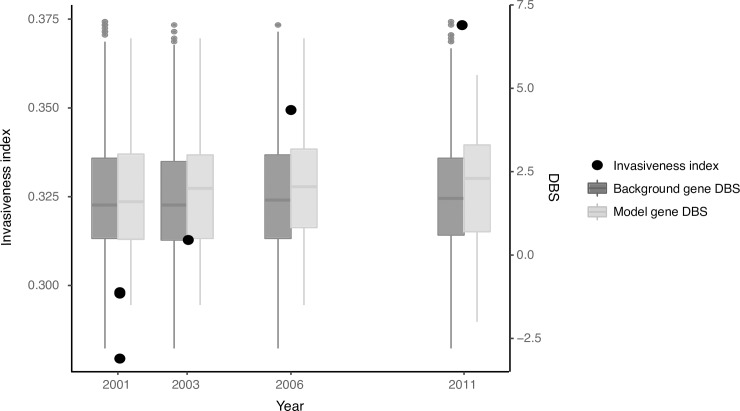
Fig 4. Invasiveness indices and DeltaBS (DBS) values for isolates collected during long term invasive infection of an immunocompromised patient provide evidence for parallel adaptation.
Black points show the increase in the invasiveness index over time. Boxplots show a significant shift in DBS distribution over the duration of carriage for genes selected by our model built from well-characterised invasive serovars as compared to the rest of the proteome. Isolates from [10]. DBS distributions for 2001 have been pooled, but are representative for all three isolates individually. The y-axis for DBS values has been truncated for better visualisation.

