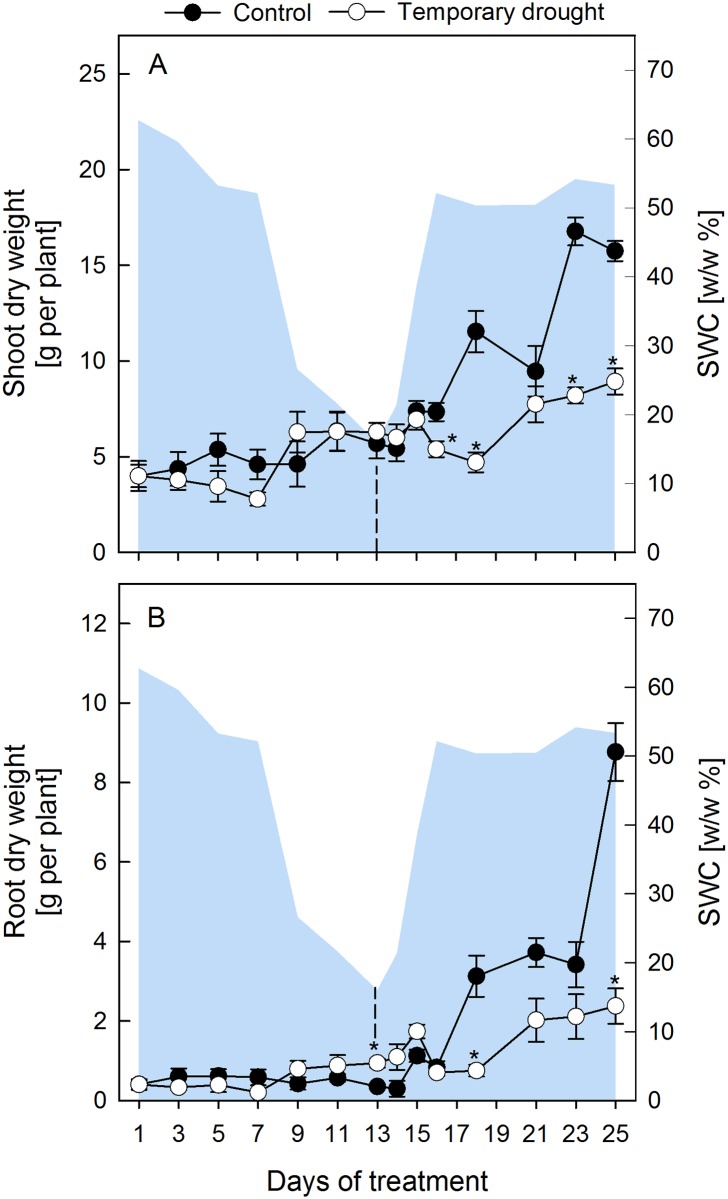
Fig 1. Change of biomass of sugar beet shoots and roots.
Plant dry weight of sugar beets shoots (A) and roots (B) of control (closed circles) and rewatered (open circles) plants. Plants were rewatered after 13 d as indicated by the dashed line. The area plot represents the gravimetric relative soil water content (SWC w/w %). All values are means ± s.e. (n = 4). Significant differences to the control plants (Duncan, α = 0.5) are indicated by *P < 0.05.

