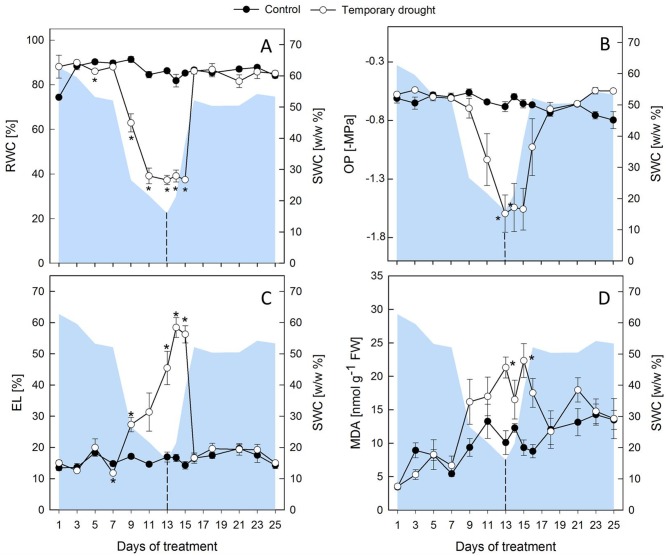
Fig 2. Plant water status and indicators of membrane damage of sugar beet leaves.
Relative water content (RWC, A) osmotic potential (OP, B), electrolyte leakage (EL, C) and malondialdehyde (MDA) concentrations (D) of leaves under regular water supply (closed circles) and temporary drought (open circles). The area plot represents the gravimetric relative soil water content (SWC w/w %). Plants were rewatered after 13 d as indicated by the dashed line. All values are means ± s.e. (n = 4). Significant differences to the control plants (Duncan, α = 0.5) are indicated by *P < 0.05.

