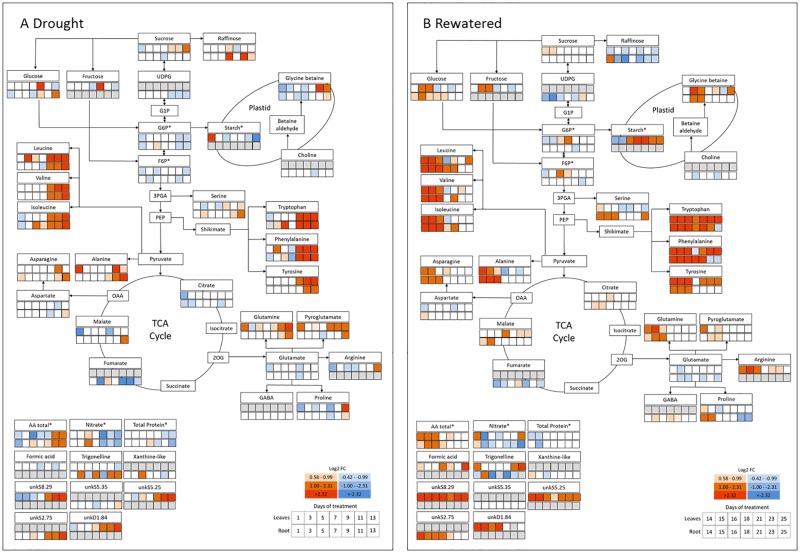
Fig 3. Metabolic map of the differences in the 1H-NMR metabolomic profile during 13 days of progressive drought with subsequent rewatering.
Changes under drought (1–13 d, A) and rewatering (14–24 d, B). The first row indicates the metabolic alterations in the leaves, the second row indicate the changes in the root. Red and blue colors indicate the log2-transformated abundance (log2 Fold change, log2FC) of each metabolite relative to the controls. Grey boxes indicate that the respective metabolite was not identified (leaf only: Fructose, starch, formic acid, unkS8.29, unkS5.25, unkD1.84. Root only: UDP-glucose-like sugar, choline, GABA, xanthine-like, unkS2.75, unkS5.35.). Asterisks (*) indicate that metabolites were determined by robotized enzyme assays (G6P, F6P, starch, total amino acids (AAt), nitrate, total protein).

