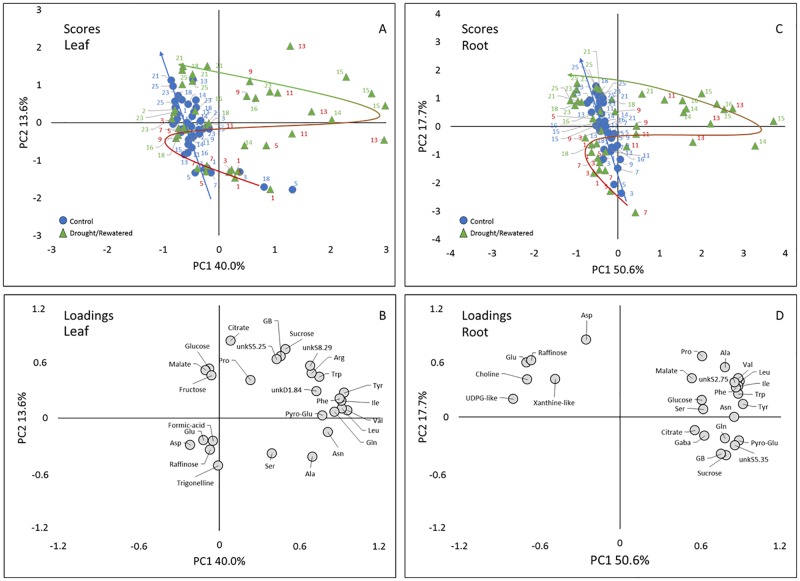
Fig 4. Result of the principal component analysis (PCA) of the 1H-NMR profiles.
Scores plot of leaf (A) and root (C), loadings plot of leaf (B) and root (D); samples size n = 3. The PC1 x PC2 plots represent 53.6% and 68.3% of total variance for leaves and roots, respectively. In the scores plot circles represent control plants and triangles represents temporary stressed plants. Trajectories in the scores plot represent the temporal development of metabolic response during the treatments (blue arrow, control; bicolored arrow: red: drought, green: rewatered. Abbreviations: Asn, asparagine; Asp, asparagine; Gaba, γ-aminobutyric acid; GB, glycine betaine; Gln, glutamine; Glu, glutamate; Ile, isoleucine; Leu, leucine; Val, valine; Phe, phenylalanine; Pro, proline; Pyro-Glu, pyroglutamate; Ser, serine; Trp, tryptophan; Tyr, tyrosine; UDPG-like, uridine diphosphate glucose-like; unk, unknown compound.

