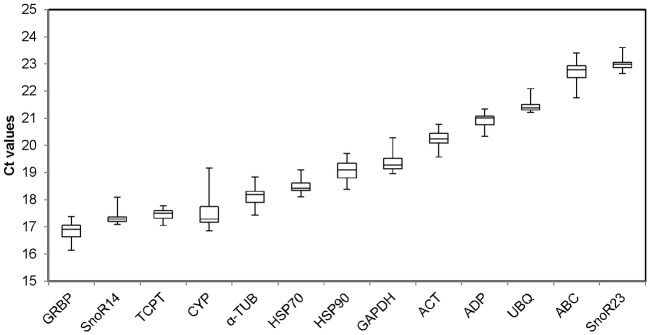
Fig 1. Ct distribution of 13 candidate reference genes.
Values are given as the cycle threshold (Ct). Expression levels of the different genes tested are shown as the 25th and 75th quartiles (upper and lower hinges), median (central horizontal lines) and whiskers. Whiskers represent maximum and minimum Ct values. Genes are shown from the most (lower Ct, left) to the least abundantly expressed (higher Ct, right).

