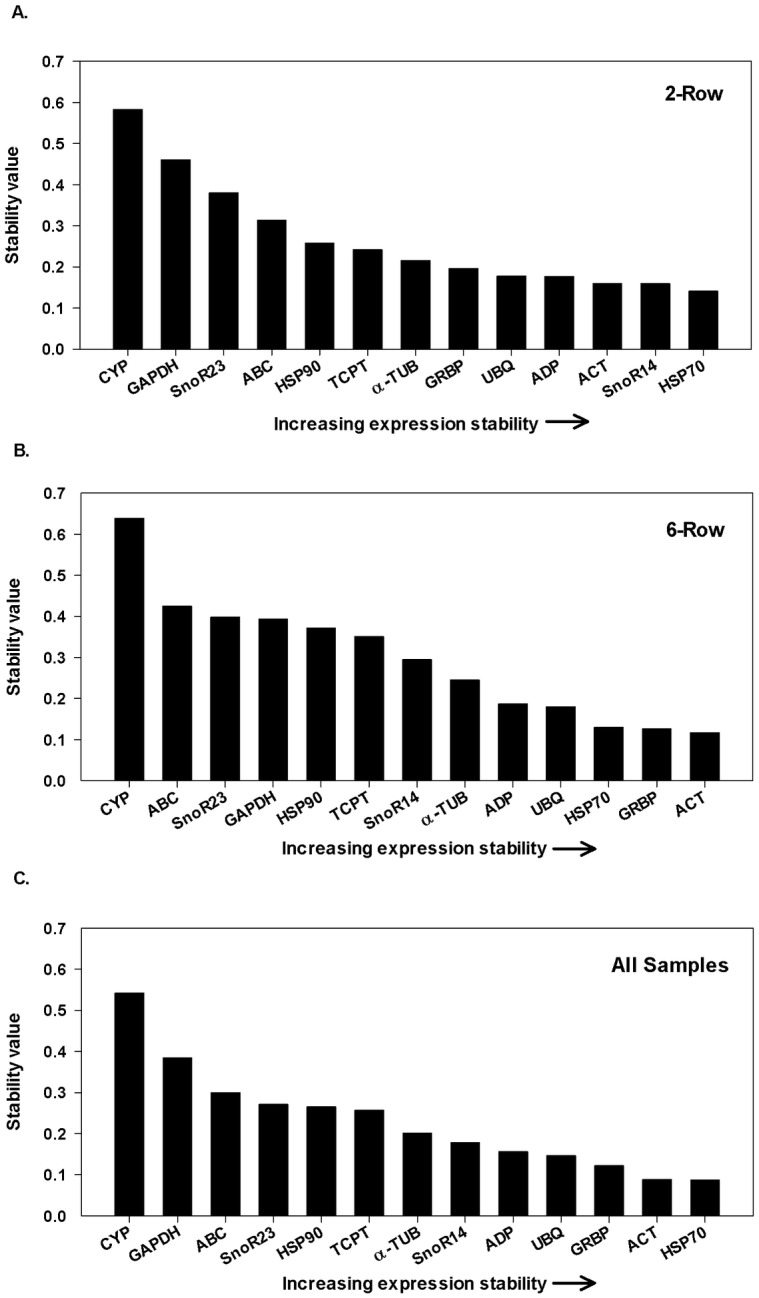
Fig 3. Gene expression stability values using NormFinder.

Gene expression stability values from least stable (left) to most stable (right) for (A) two-row barley, (B) six-row barley, and (C) all samples (two- and six-row combined).

Gene expression stability values from least stable (left) to most stable (right) for (A) two-row barley, (B) six-row barley, and (C) all samples (two- and six-row combined).