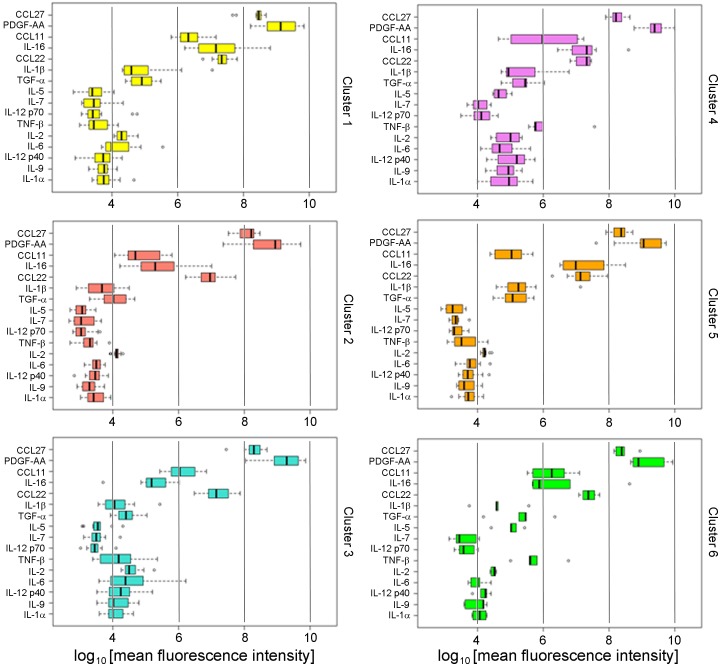
Fig 2. Signature patterns of BWHS subjects.
Quantification of sixteen cytokines (median fluorescence intensity in logarithmic scale) that resolve the six clusters of the signature are shown with side-by-side boxplots. Individual cytokines are identified at left: CCL27, C-C motif chemokine ligand 27, also known as CTACK; PDGF-AA, platelet-derived growth factor α polypeptide; CCL11, C-C motif chemokine ligand 11; IL-16, interleukin 16; CCL22, C-C motif chemokine ligand 22; IL-1β, interleukin 1β; TGF-α, transforming growth factor α; IL-5, interleukin 5; IL-7, interleukin 7; IL-12 p70, interleukin 12, 70 kDa subunit; TNF-β, tumor necrosis factor β; IL-2, interleukin 2; IL-6, interleukin 6; IL-12 p40, interleukin 12, 40 kDa subunit; IL-9, interleukin 9; IL-1α, interleukin 1α. Vertical guide bars shown for reference to permit comparison among clusters. Subjects reporting that they were taking metformin or NSAIDs were excluded.

