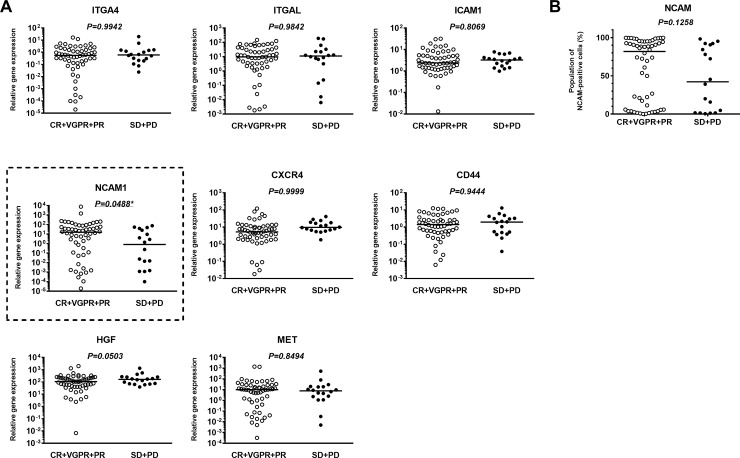
Fig 1. Comparison of levels of cell adhesion molecules between good and poor responders to bortezomib plus dexamethasone (Bd) therapy.
(A) Comparison of the expression of several genes associated with cell adhesion molecules among good responders (CR+VGPR+PR) and poor responders (SD+PD) to Bd therapy. (B) Comparison of cell-surface expression of NCAM by FACS among the good and poor responders to Bd therapy. * indicates statistical significance (p < 0.05) as calculated by a Mann–Whitney U test.

