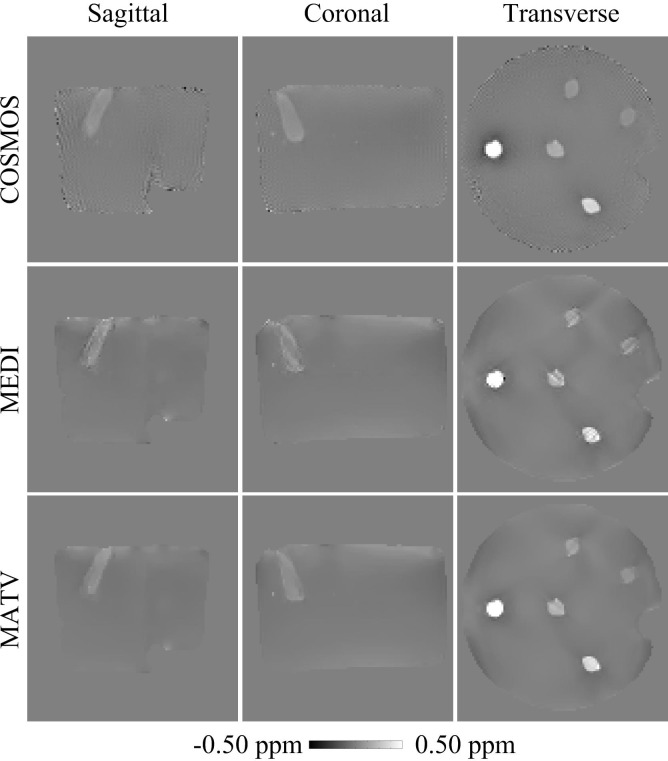
Fig 1. QSM reconstructions for the phantom dataset.
First row: sagittal, coronal, and transverse views of susceptibility maps reconstructed by COSMOS. Second row: sagittal, coronal, and transverse views of susceptibility maps reconstructed by MEDI. Third row: sagittal, coronal, and transverse views of susceptibility maps reconstructed by MATV.

