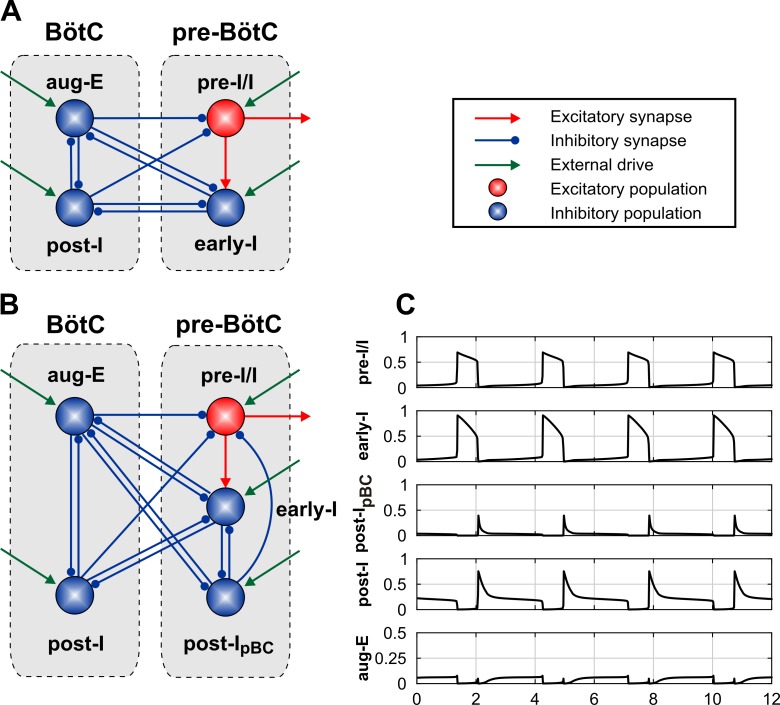
Fig 9. Schematic of neural interactions within the pre-BötC-BötC core network and model performance.
(A) Schematic of the pre-BötC-BötC respiratory network from the model of Rubin et al. [10]. (B) Model schematic of the proposed extended model that includes the novel post-IpBC population within the pre-BötC. (C) Model performance under normal conditions (without stimulations). The traces represent output activity of each population in the network.

