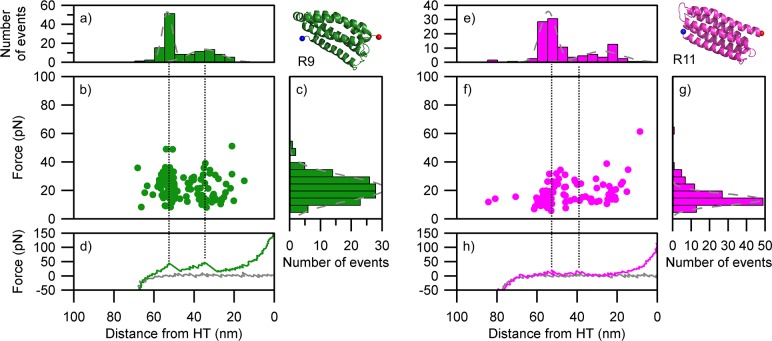
Fig 4. Unfolding patterns of the α-helix monomers as determined by smAFM.
(a-d) R9 (87 traces). (e-h) R11 (79 traces). (a & e) length histogram indicating the distance from unfolding event to HaloTag standard; (b & f) scatter plot showing force vs position for all unfolding events; (c & g) histogram the force associated with unfolding events; (d & h) representative force extension retraction curve (green & magenta line) showing how the unfolding events relate to scatter plot and length histogram (black dotted line), gray line represents approach curve for AFM tip. Gray dotted lines on (c & g) histograms represent Gaussian fits.

