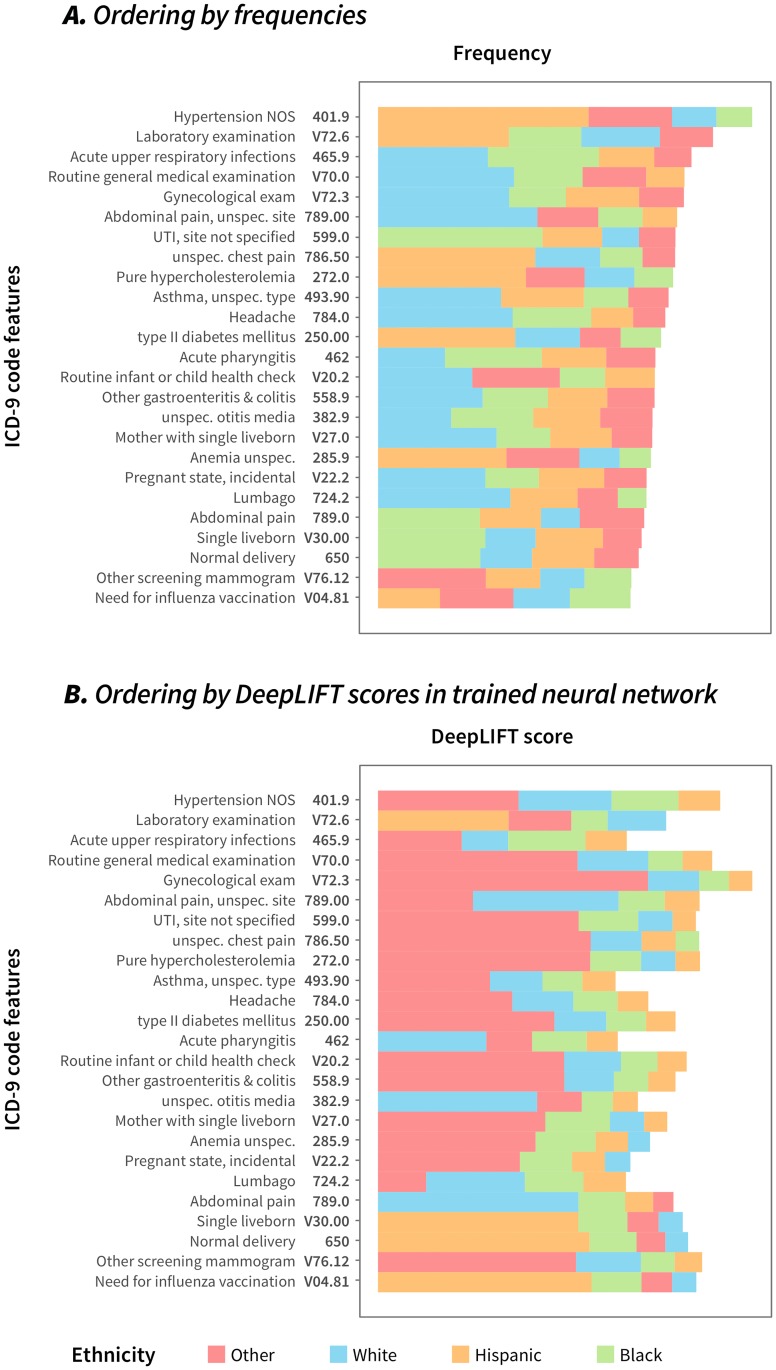
Fig 3. Visualizing class orderings for the 25 most common features.
We constructed natural orderings of features for the 25 most common ICD9 code features, using (A) frequency information and (B) DeepLIFT scores. Frequency scores were mean-centered; higher scores indicate larger contribution by a feature to a class. These orderings rank the contribution of an ICD9 code to a particular class, and are visualized as a stacked bar. The strongest (positive) feature-to-class contributions are represented by the rightmost bar; the length of the bar corresponds to the magnitude of the contribution on a linear scale. Scores were summed across all samples.

