Figure 5.
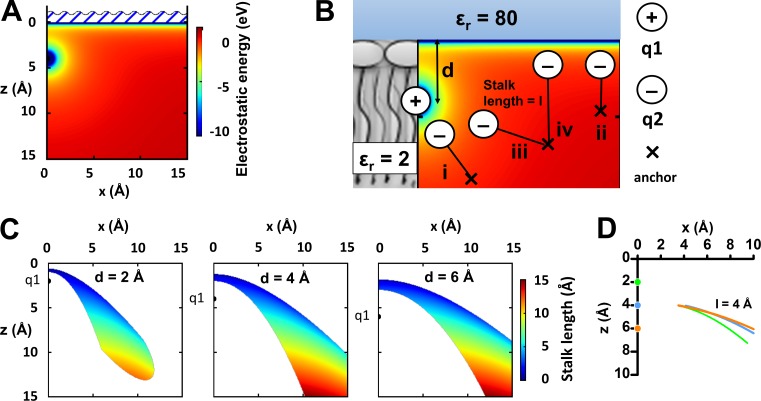
The cutoff model. (A) Electrostatic energy for a charge q1 = 1 e at (0,4) Å and q2 = ‒1 e at (x,z) Å. (B) Schematic illustration of the cutoff model. At one anchor position, the charge q2 is attracted to q1, independent of the stalk length l (i). At another anchor position, the charge q2 is attracted to the extracellular solution, independent of the stalk length (ii). At certain anchor positions, the charge q2 is attracted either to q1 for shorter stalk lengths (iii) or to the extracellular solution for longer stalk lengths (iv). (C) Critical stalk lengths (i.e., the length at which the charge q2 is attracted equally well to the charge q1 or to the extracellular solution) for a stalk fixed at (x,z) Å. Charge q1 = 1 e at d = (0,2), (0,4), (0,6) Å and q2 = ‒1 e at the end of the stalk with different lengths (according to the color coding). (D) Positions for the cutoff anchor point when the stalk length is 4 Å (l = 4 Å). Charge q1 = 1 e at d = (0,2), (0,4), (0,6) Å and q2 = ‒1 e at the end of the stalk.

