Figure 1.
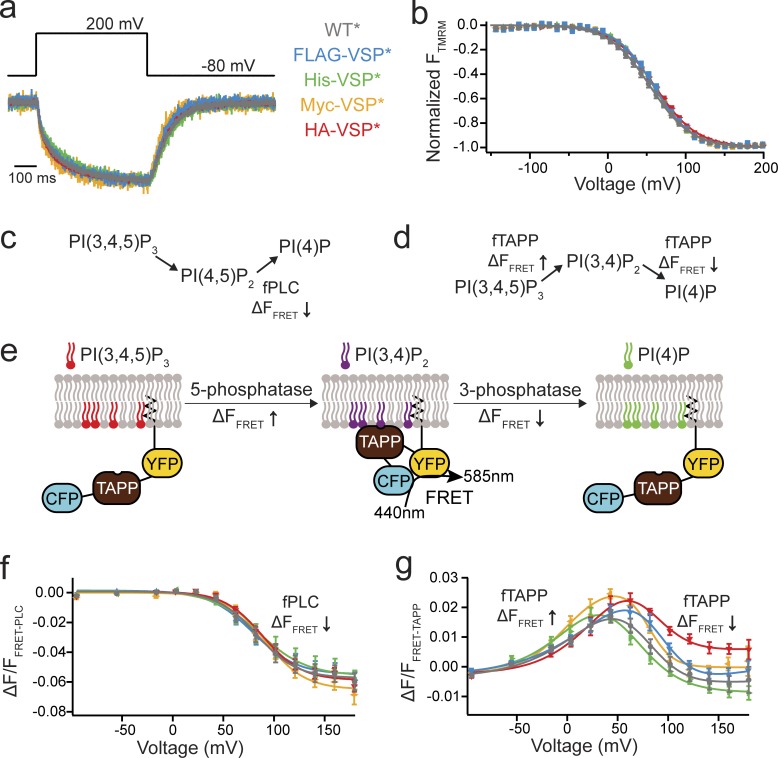
N-terminal tags do not alter Ci-VSP function. (a) Representative TMRM fluorescence traces during a step from a holding potential of −80 to 200 mV for WT*, FLAG-VSP*, His-VSP*, Myc-VSP*, and HA-VSP* (where the * indicates TMRM labeling). Traces are normalized to the maximal fluorescence change. The voltage trace shows the actual voltage recorded during acquisition. (b) Normalized TMRM fluorescence versus voltage relationship. Data fit to single Boltzmann equations. None of the N-terminal tags alter the kinetics or the voltage dependence of the VSD motions, indicating they are not influencing VSP function. n ≥ 11. Some errors bars are smaller than the size of the symbols. (c and d) Schematics of the VSP reactions where the fPLC monitors the PI(4,5)P2 reactions and the fTAPP monitors the PI(3,4)P2 reactions. (e) Cartoon representation of fTAPP binding and release with increasing and decreasing PI(3,4)P2 concentrations. The binding of fTAPP to PI(3,4)P2 results in a conformational change that increases the FRET signal. Similarly, a reduction of PI(3,4)P2 results in a decrease in the FRET signal. (f) ΔF/F fPLC FRET ratio versus voltage relationship shows a fluorescence decrease (net 5-phosphatase reaction). n ≥ 9. Data fit with a single Boltzmann equation. (g) ΔF/F fTAPP FRET ratio versus voltage relationship with the fluorescence increase (net 5-phosphatase reaction) predominating at lower voltages and the fluorescence decrease (net 3-phosphatase reaction) predominating at higher voltages. n ≥ 11. Data fit with a double Boltzmann equation. Error bars are ±SEM.

