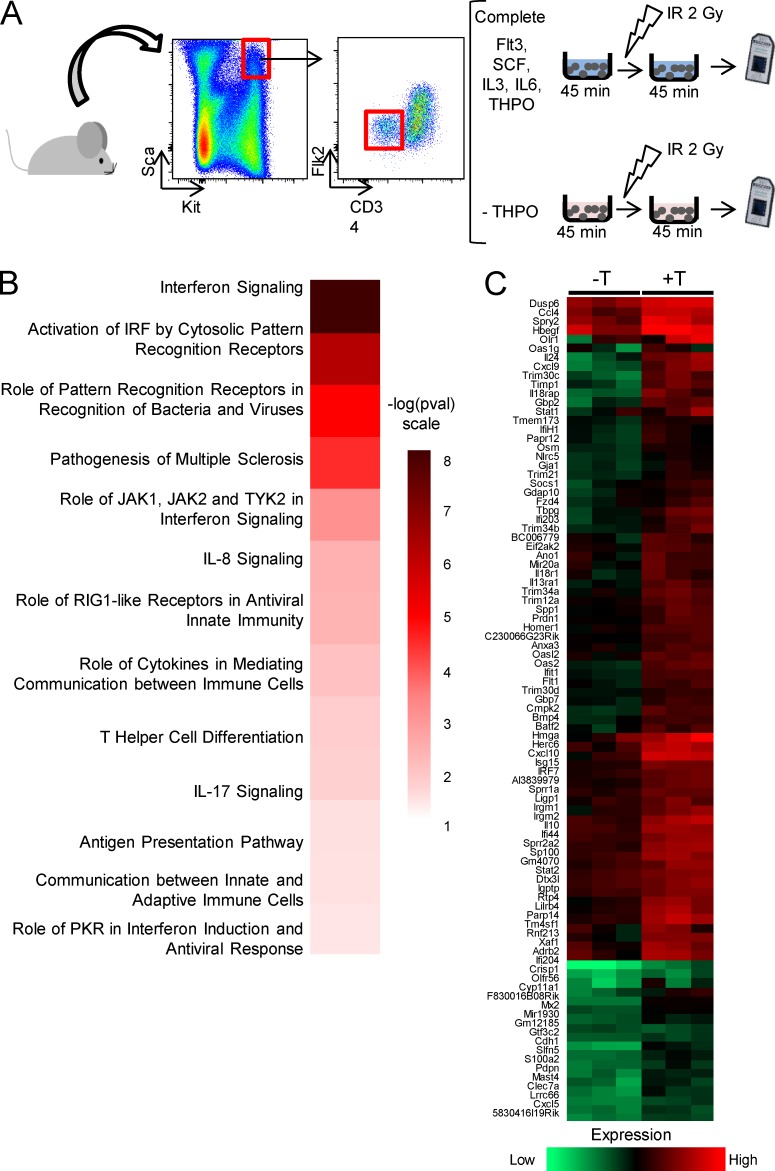
Figure 5.
THPO induces an IFN signature in HSCs. (A) Experimental design for microarray analysis of THPO differentially regulated genes in HSCs. Gray objects represent Affimetrix Gene Chips (microarrays) used to measure gene expression in cells after treatments. (B) Heat map of ingenuity pathway analysis p-values for the top canonical pathways of differentially regulated genes, obtained using the Perseus software (MaxQuant). (C) Means of triplicate values for up-regulated genes calculated and clusterized using the Perseus software.

