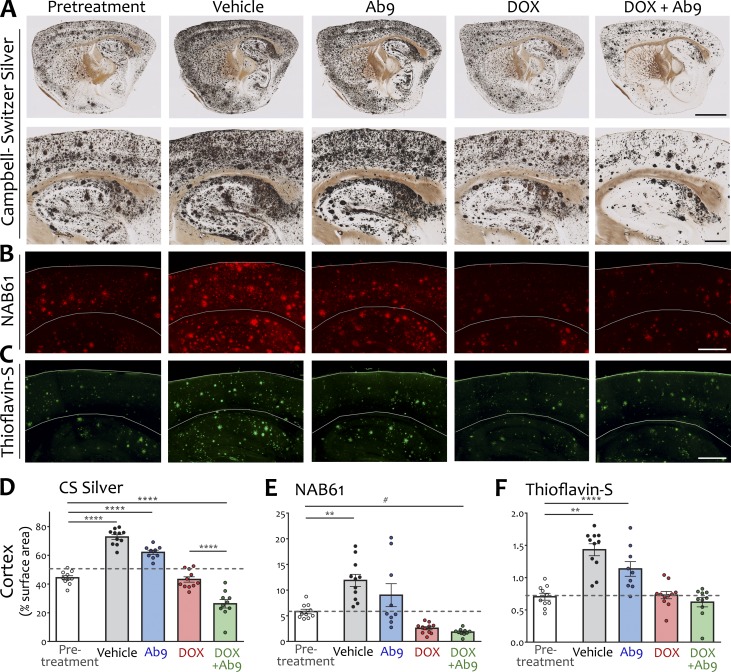
Figure 2.
Transgene suppression stopped further plaque formation; adding anti-Aβ antibody promoted plaque clearance. (A) Sagittal sections stained by the Campbell–Switzer method reveal total plaque load in each treatment condition. Bottom row shows higher-magnification images centered on hippocampus and overlying cortex. Bars: (top row) 2,000 µm; (bottom row) 500 µm. (B) NAB61 immunofluorescence for oligomeric Aβ in dorsal hippocampus and overlying cortex. Gray lines indicate location of pial surface and corpus callosum. Bar, 500 µm. (C) Thioflavin-S stain for fibrillar amyloid in dorsal hippocampus and overlying cortex. Bar, 500 µm. (D–F) Quantification of cortical plaque area: CS silver (D), NAB61 (E), and thioflavin-S (F). Dashed line in scatter plots indicates the pretreatment plaque load for each stain. Significant comparisons against pretreatment or between dox and dox + Ab9 are shown; other comparisons are listed in Table S1. n = 9–11/group. **, P < 0.01; ****, P < 0.0001; #, P = 0.09. Error bars show means ± SEM.

