Figure 3.
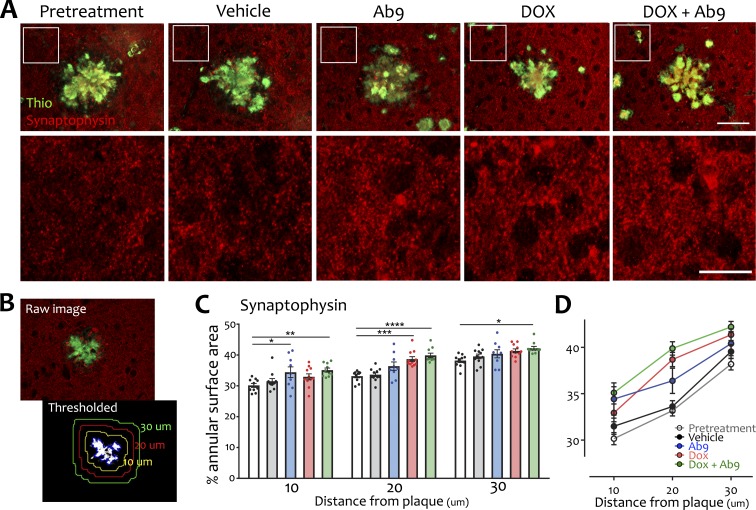
Synaptic recovery surrounding amyloid cores after combination anti-Aβ treatment. (A) Synaptophysin immunofluorescence (red) was measured in a zone immediately surrounding fibrillar plaques identified by thioflavin-S (green; top row). A magnified portion of the synaptophysin immunofluorescence (outlined in top row) is shown at higher magnification in the bottom row of images. Bars: (top row) 50 µm; (bottom row) 20 µm. (B) Illustration of image processing for area quantitation. Raw fluorescence images were converted to black and white for each color channel. The thresholded thioflavin image was used to outline the plaque, and this outline was expanded to delineate concentric rings that were applied to the thresholded synaptophysin image. (C and D) The area of synaptophysin staining was measured in concentric rings 0–10, 10–20, and 20–30 µm from the plaque edge. Graphs show individual scatter (C) and group mean (D) at each distance. Significant comparisons against pretreatment are shown; other comparisons are listed in Table S1. n = 9–11/group. *, P < 0.05; **, P < 0.01; ***, P < 0.001; ****, P < 0.0001. Error bars show means ± SEM.

