Figure 4.
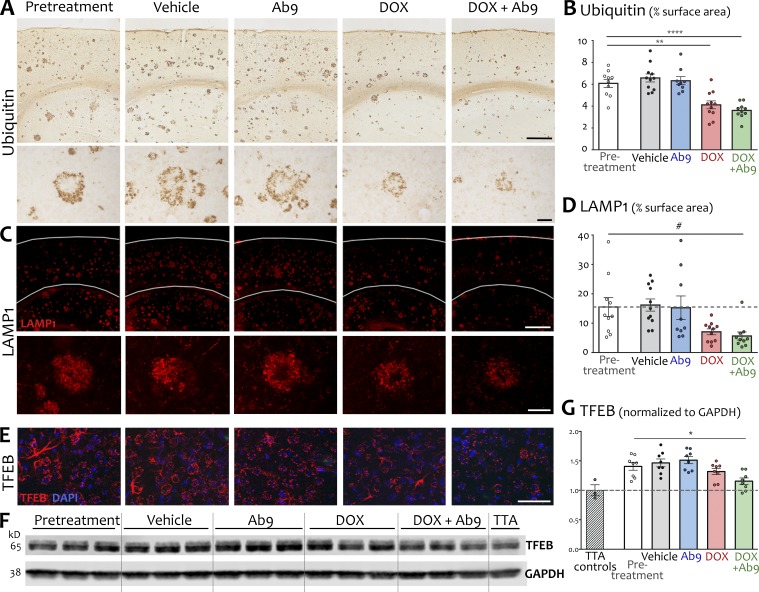
Therapeutic reduction of extracellular Aβ allowed clearance of intraneuronal pathology. (A) Representative images of ubiquitin immunohistochemistry for dystrophic neurites. Top row shows immunostaining in cortex and dorsal hippocampus at low magnification. Higher-magnification images (bottom row) show a single neuritic plaque to illustrate the remediation of neuritic swellings with dox and dox + Ab9 treatment. Bars: (top row) 500 µm; (bottom row) 50 µm. (B) Quantification of ubiquitin immunostaining as percent of cortical surface area. Dashed line indicates mean area of ubiquitin signal in pretreatment animals. (C) Representative immunofluorescence for the lysosomal marker LAMP1. Top row shows immunostaining in cortex and dorsal hippocampus at low magnification. Gray lines indicate rough location of pial surface and corpus callosum. Higher-magnification images (bottom row) show LAMP1 signal surrounding a single representative plaque in each condition. Bars: (top row) 500 µm; (bottom row) 50 µm. (D) Quantification of LAMP1 immunostaining as percent of cortical surface area. Dashed line indicates mean area of LAMP1 signal in pretreatment animals. (E) TFEB immunofluorescence (red) was not localized to plaques but appeared diffusely throughout the cortex, with lower signal intensity in dox and dox + Ab9 groups. Bar, 50 µm. (F) Representative Western blot for hippocampal TFEB expression. (G) Quantification of TFEB Western blots, expressed relative to GAPDH n = 8/group (3 for TTA). Dashed line in scatter plot indicates normalized mean TFEB expression in TTA control animals. TTA values in this and subsequent figures are for illustration only; statistical comparisons included only APP/TTA groups. Post hoc comparisons against pretreatment are shown; other post hoc comparisons are listed in Table S1. n = 9–11/group for histological analysis and n = 8/group for protein analysis. *, P < 0.05; **, P < 0.01; ****, P < 0.0001; #, P = 0.054. Error bars show means ± SEM.

