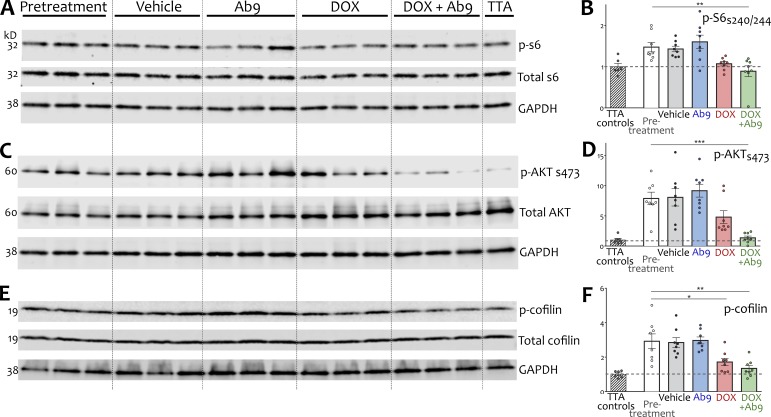
Figure 5.
Hyperactive mTOR signaling was normalized by combination anti-Aβ treatment. (A and B) Representative Western blots and quantitation for hippocampal mTORC1-dependent phosphorylation of S6 ribosomal protein. (C and D) Western blots and quantitation for mTORC2-dependent phosphorylation of protein kinase B, also known as Akt. Note the y-axis scale in D, reflecting the dramatic elevation of mTORC2 activity in pretreatment APP/TTA mice compared with TTA controls. (E and F) Western blots and quantitation for cofilin phosphorylation downstream of mTORC2. Measurements are expressed as a ratio of phosphorylated to total protein for each marker. n = 8/group (6 for TTA). Dashed line in scatter plots indicates normalized mean expression in TTA control animals. Comparisons against pretreatment are shown; other post hoc comparisons are listed in Table S1. *, P < 0.05; **, P < 0.01; ***, P < 0.001. Error bars show means ± SEM.

