Figure 5.
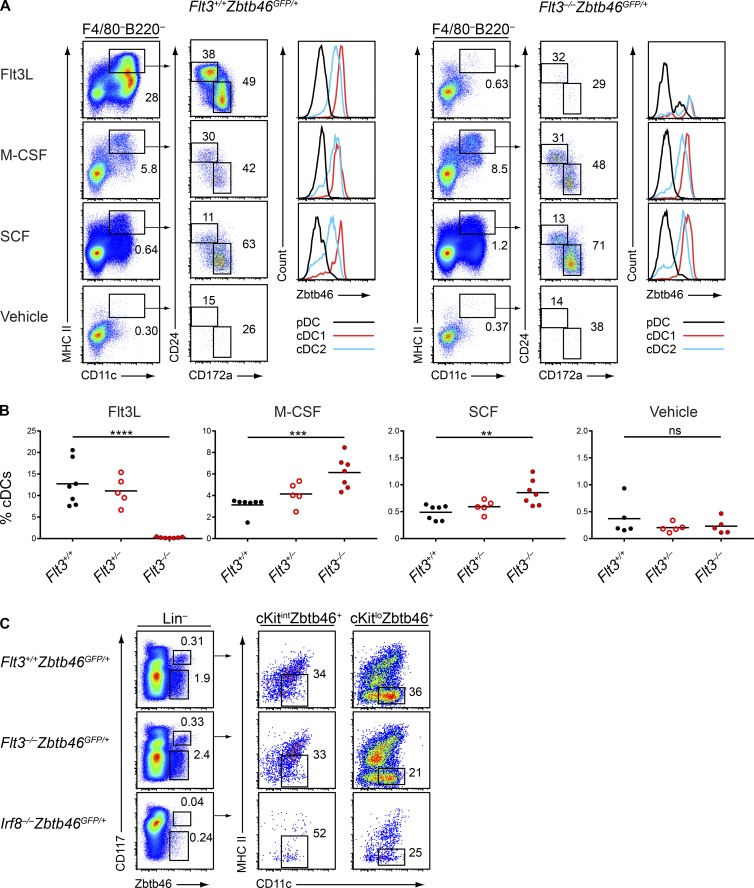
Flt3−/− BM generates mature DCs in response to M-CSF or SCF and contains committed DC progenitors. (A and B) BM cells from mice of the indicated genotypes were treated with vehicle, Flt3L, M-CSF, or SCF and cultured for 7 d. Live cells were subsequently analyzed by flow cytometry for development of DCs. (A) Shown are representative two-color histograms of live cells pregated as indicated above the plots and one-color histograms of Zbtb46GFP expression in cells of the indicated subtype. Numbers represent the percentage of cells within the indicated gates. (B) Summary data for the percentage of cDCs in each culture. Dots represent biological replicates; small horizontal lines indicate the mean. Data are pooled from five independent experiments (n = 5–7 mice per genotype). (C) BM cells from mice of the indicated genotypes were analyzed by flow cytometry for DC progenitor populations; lineage markers include CD3, CD19, CD105, Ter119, and Ly-6G. Representative two-color histograms are shown of live cells pregated as indicated above the plots. Numbers specify the percentage of cells within the indicated gates. Data are representative of four independent experiments (n = 7 mice per genotype). ns, not significant (P > 0.05); **, P < 0.01; ***, P < 0.001; ****, P < 0.0001 using unpaired, two-tailed Student's t test.

