Figure 6.
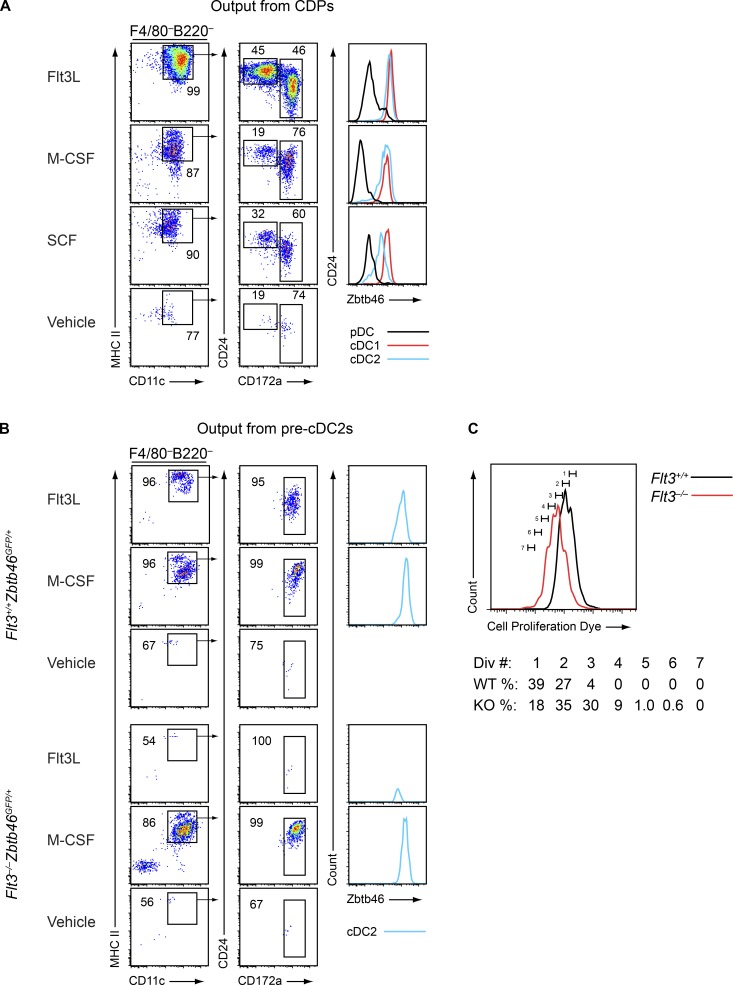
Committed DC progenitors can mature in response to M-CSF and SCF. (A) CDPs (Lin–CD117intCD135+CD115+CD11c–MHCII–) were sorted from Zbtb46GFP/+ mice and cultured with vehicle, Flt3L, M-CSF, or SCF for 5 d. Cells were subsequently analyzed by flow cytometry for development of DCs. Shown are representative two-color histograms of live cells pregated as indicated above the plots and one-color histograms of Zbtb46GFP expression. Numbers specify the percentage of cells within the indicated gates. Data are representative of three independent experiments (sorted cells from three to five mice were pooled in each individual experiment). (B) Pre-cDC2s (Lin–CD115+CD11c+MHCII–Zbtb46+) were sorted from Flt3+/+Zbtb46GFP/+ or Flt3−/−Zbtb46GFP/+ mice as indicated and cultured with vehicle, Flt3L, or M-CSF for 5 d. Cells were subsequently analyzed by flow cytometry for development of DCs. Shown are representative two-color histograms of live cells pregated as indicated above the plots and one-color histograms of Zbtb46GFP expression in cells of the indicated subtype. Numbers specify the percentage of cells within the indicated gates. Data are representative of three independent experiments (sorted cells from three to five mice per genotype were pooled in each individual experiment). (C) Pre-cDC2s were sorted from Flt3+/+Zbtb46GFP/+ or Flt3−/−Zbtb46GFP/+ mice, labeled with Cell Proliferation Dye (CPD), and cultured with M-CSF for 5 d. Cells were subsequently analyzed by flow cytometry for dilution of CPD to determine the number of divisions they underwent. Shown is a representative one-color histogram of CPD levels and the percentage of cells at each division. Data are representative of two independent experiments (sorted cells from three mice per genotype were pooled in each individual experiment).

