Figure 7.
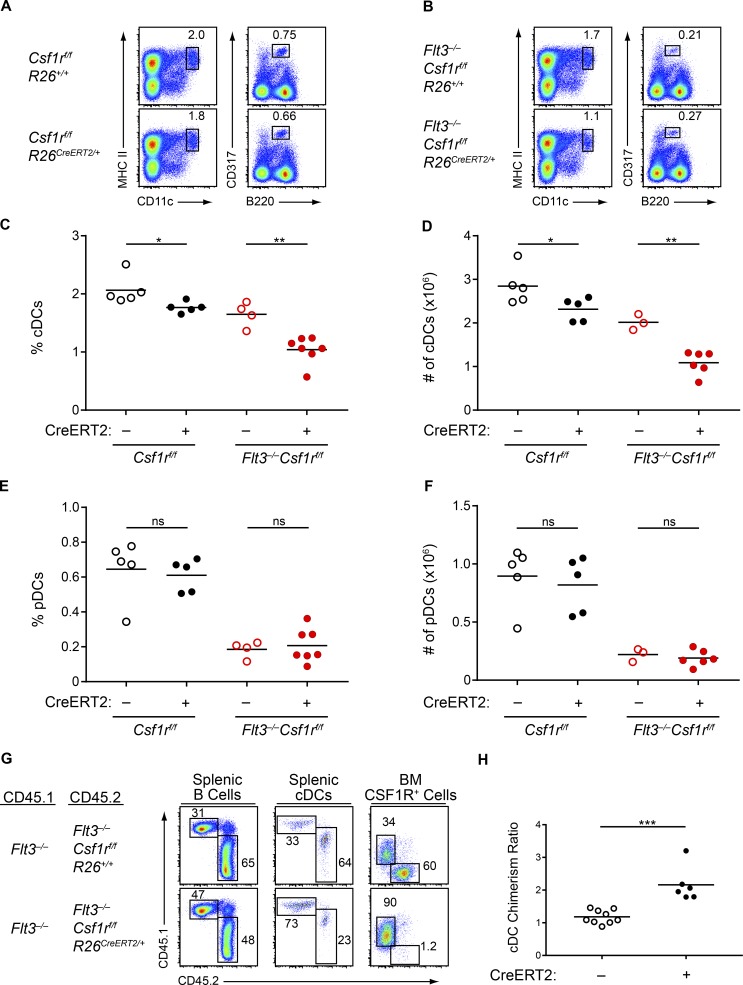
cDC development in Flt3−/− mice is dependent on CSF1R. (A–F) Mice of the indicated genotypes were treated with tamoxifen to delete Csf1r. After treatment, splenocytes were analyzed by flow cytometry for DC populations. (A and B) Shown are representative two-color histograms of live cells. Numbers specify the percentage of cells within the indicated gates. (C–F) Summary data of the percentage (C) and number (D) of splenic cDCs and for the percentage (E) and number (F) of splenic pDCs in mice of the indicated genotypes. Dots represent biological replicates; small horizontal lines indicate the mean. Data are pooled from seven independent experiments. (n = 3–7 mice per genotype). (G and H) WT CD45.1+ mice were lethally irradiated and reconstituted with Flt3−/− CD45.1+:Flt3−/−Csf1rf/fR26+/+CD45.2+ BM at a 1:1 ratio (CreERT2–) or Flt3−/−CD45.1+:Flt3−/−Csf1rf/fR26CreERT2/+CD45.2+ BM at a 1:1 ratio (CreERT2+). After reconstitution and tamoxifen treatment to delete Csf1r, spleens and BM were analyzed by flow cytometry. (G) Shown are representative two-color histograms (pregating, above plots; splenic B cells, B220+CD24+; splenic cDCs, CD11c+MHCII+; BM CSF1R+ cells, CD115+). Numbers specify the percentage of cells within the indicated gates. (H) Summary data of the chimerism ratio of splenic cDCs presented as the ratio of CD45.1+ to CD45.2+ cDCs normalized to the ratio of CD45.1+ to CD45.2+ B cells within the same mouse. Dots represent individual mice; small horizontal lines indicate the mean. Data are pooled from four independent experiments (n = 6–9 chimeras per genotype). ns, not significant (P > 0.05); *, P < 0.05; **, P < 0.01; ***, P < 0.001 using unpaired, two-tailed Student's t test.

