Figure 6.
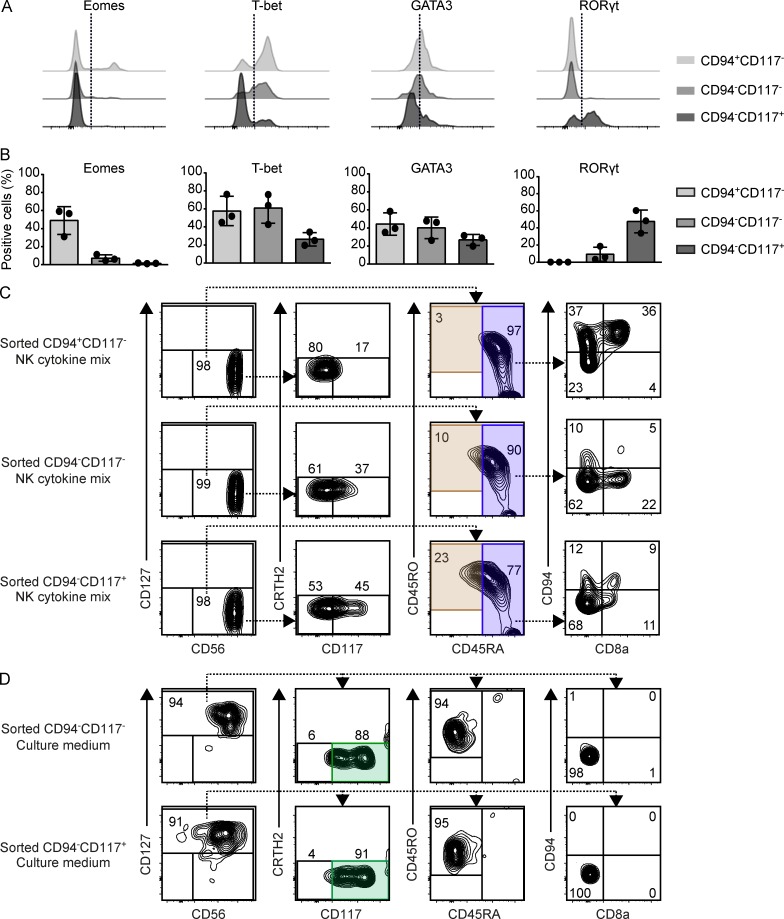
Distinct differentiation properties of CD8a− int-ILC subpopulations. (A and B) Expression of the transcription factors Eomes, T-bet, GATA3, and RORγt by the indicated subpopulations of CD8a− int-ILC ex vivo. Histograms depict the results with one fetal intestine (A), and the graphs depict quantification of data obtained from three intestines (B; two independent experiments). Error bar shows mean ± SD. (C and D) Purified CD94+CD117−CD8a− int-ILC, CD94−CD117−CD8a− int-ILC, and CD94−CD117+CD8a− int-ILC populations were cocultured in 96-well plates at 500 cells/well with irradiated OP9-DL1 stromal cells for 7 d with (C) culture medium supplemented with NK cytokine mix or (D) culture medium alone. Generated cells were analyzed by flow cytometry. Representative biaxial plots depict the phenotypes of the generated Lin−CD7+ cells based on the gating strategy for ILC1, ILC2, ILC3, NK, and int-ILC subsets as shown in Fig. 3 A, for the five combinations of cell populations and culture conditions indicated. Duplicated wells were included in each condition. Representative plots show a single duplicate (three to four independent experiments).

