Figure 1.
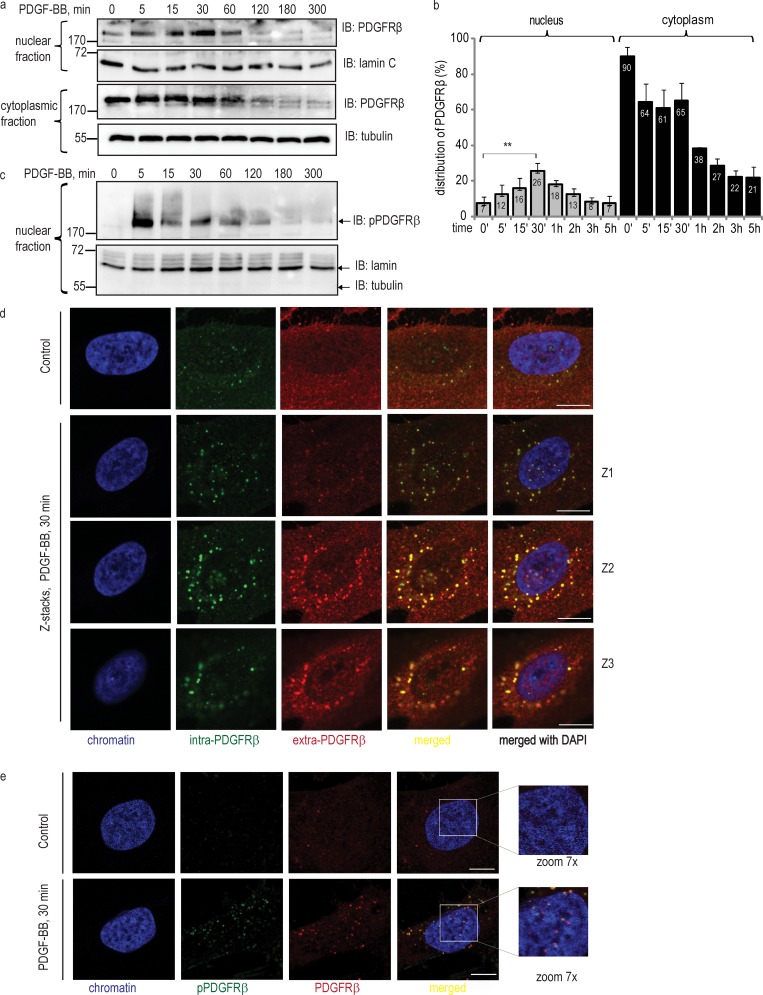
Nuclear translocation of PDGFRβ in response to ligand stimulation. (a) Immunoblotting analysis of nuclear and cytoplasmic distribution of PDGFRβ. Nuclear and cytoplasmic fractions were immunoblotted for total PDGFRβ, showing nuclear accumulation of PDGFRβ (top) versus cytoplasmic localization (bottom). Lamin A/C and tubulin were used as markers for nuclear and cytoplasmic fractions, respectively. (b) The distribution of PDGFRβ in the nucleus and in the cytoplasm was quantified as emission values of the immunoblot signal, normalized to the signal of the markers. Total amount of receptor in the cell was calculated as the sum of signal intensity values detected in nuclear and cytoplasmic fractions before stimulation with PDGF-BB (0 min), which was taken as 100%. The signal values obtained during the course of stimulation were calculated relative to this value. Error bars indicate SD. Quantification was based on three independent experiments, and t test statistical analysis was performed for the difference between PDGFRβ signal in unstimulated nuclei and at 30 min of stimulation with PDGF-BB; **, P = 0.0092. (c) Immunoblotting of nuclear fractions using a phosphotyrosine antibody, detecting phosphorylated PDGFRβ (top). The purity of the fractionation was verified (bottom). (d) Nuclear localization of PDGFRβ as detected by costaining with two types of PDGFRβ antibodies. PDGFRβ was stained with intra-PDGFRβ antibody (green) and with extra-PDGFRβ antibody (red); chromatin was stained with DAPI (blue). Merged images are shown with (red, green, and blue) and without the nucleus (red and green). Z1, Z2, and Z3 rows of images show stacks through the nucleus of cells simulated with PDGF-BB for 30 min. Bars, 10 µm. (e) Colocalization of immunostaining for total and phospho-specific PDGFRβ antibodies. Cells were immunostained with total PDGFRβ antibody (red) and pTyr (PY99) antibody (green); chromatin was stained with DAPI (blue). Images were taken with the focus on the nucleus; yellow indicates colocalization. Molecular mass was measured in kilodaltons. Bars, 10 µm. IB, immunoblotting.

