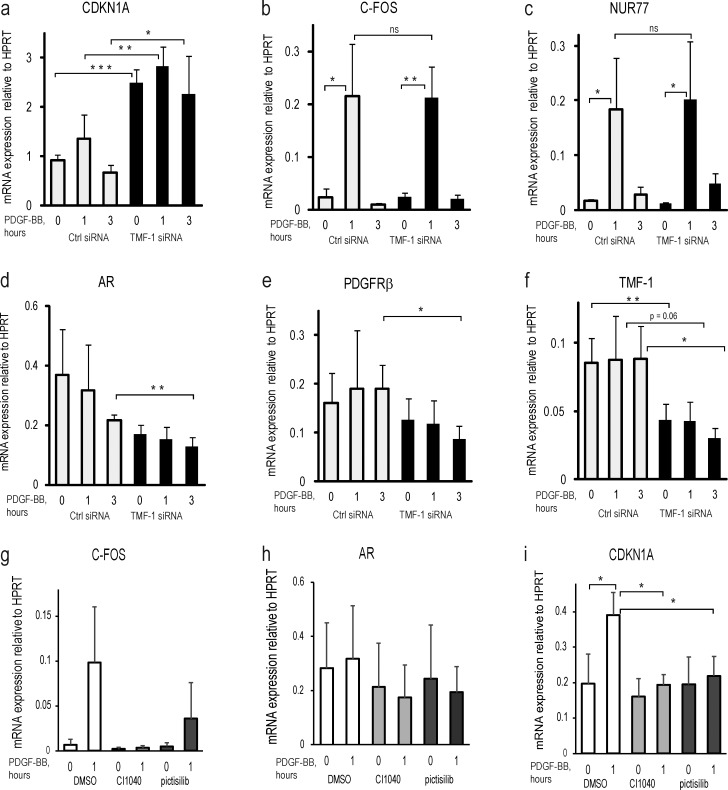
Figure 8.
Transcriptional analysis of target genes during PDGF-BB stimulation at TMF-1 knockdown or inhibition of PDGFRβ kinase activity and cytoplasmic signaling via Erk1/2 and PI3-kinase. Cells were transfected with control (white bars) or TMF-1 (black bars) siRNA (a–f) or pretreated with CI1040 (light gray bars) and pictilisib inhibitor (dark gray bars; g–i) before stimulation with PDGF-BB. mRNA expression of the following genes was analyzed by quantitative PCR to test for the knockdown efficiency: CDKN1A, C-FOS, nuclear receptor NUR77, AR, PDGFRβ, and TMF-1. ΔΔCt was calculated as a log2 of the difference between cycle threshold values of a reference gene HPRT and a gene of interest. The levels of expression represent an average signal obtained from four biological replicates with SD indicated on the graph. Two-tailed t test statistical analysis was performed for the difference between mRNA expression levels of CDKN1A in control cells versus siTMF knockdown cells. *, P < 0.05; **, P < 0.01; ***, P < 0.001. ns, not significant.

