Figure 1.
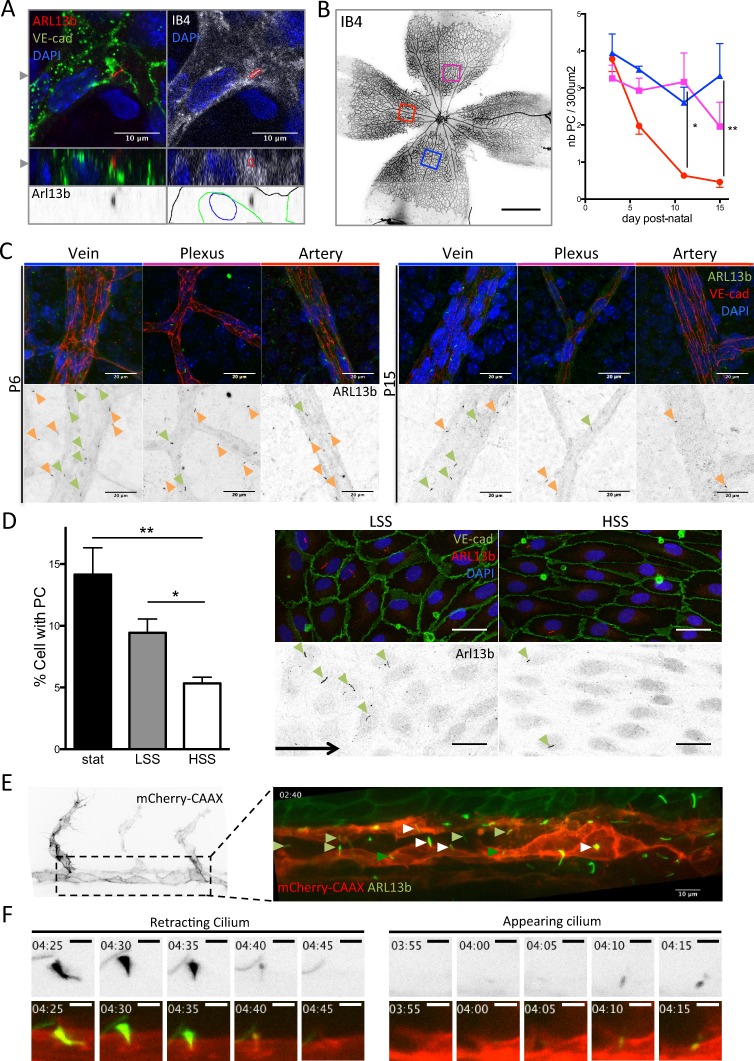
Primary cilia are present in ECs, and their presence correlates with shear stress levels. (A) Primary cilia belonging to ECs were found in the retinal vasculature. Top images present one z-stack (depth 0.26 µm) showing the cilium within the vasculature and overlapping with Isolectin staining (red outline on the right upper image highlights the cilium localization). Bottom images present the corresponding z-projection showing the cilium embedded in the endothelial layer (black outline, Isolectin B4; blue outline, DAPI; green outline, VE-cadherin). The gray arrowheads indicate the cut-planes corresponding to the z-stack visualization. (B) Retinas from mouse pups were collected at P3, P6, P11, and P15 and stained for VE-cadherin (EC junctions), ARL13b (primary cilia), and DAPI (nuclei). The number of primary cilia present in the different areas of the vasculature was quantified over time and maturation of the vessels in different animals (red, artery; magenta, plexus; blue, vein; n = 3 for each time point; median ± interquartile range (IQ); two-way ANOVA. Data distribution was assumed to be normal but this was not formally tested). Bar, 700 µm. (C) Representative images are shown for each region. Green arrowheads, endothelial primary cilia; orange arrowheads, primary cilia from surrounding cells. Bars, 20 µm. (D) Monolayers of HUVECs were subjected to different shear stress conditions for 24 h (n = 8; mean ± SEM; two-sided Wilcoxon test) and then stained for VE-cadherin, ARL13b (primary cilia), and DAPI. The percentage of cells with a PC within the monolayers was quantified. Representative images are shown for static (stat) and HSS conditions. Green arrowheads, endothelial primary cilia; black arrow, flow direction. Bars, 20 µm. (E) A 24- to 30-hpf zebrafish embryo of double transgenic line Tg(kdr-l:ras–Cherrys916; β-actin::arl13b-eGfp) was used to identify the dynamics of endothelial cilia over time. First image shows the EC labeling (referred to as mCherry-CAAX). Second image shows the luminal cilia (white arrowhead, disappearing cilia; light green arrowhead, stable cilia; dark green arrowhead, appearing cilia). Movie of the cilia dynamics is provided in Video 1. Bar, 10 µm. (F) Stills extracted from Videos 2 and 3 showing the retraction of the cilium (“retracting cilium”) or its formation (“appearing cilium"). Bars, 3 μm. *, P < 0.05; **, P < 0.01. PC, primary cilium.

