Figure 3.
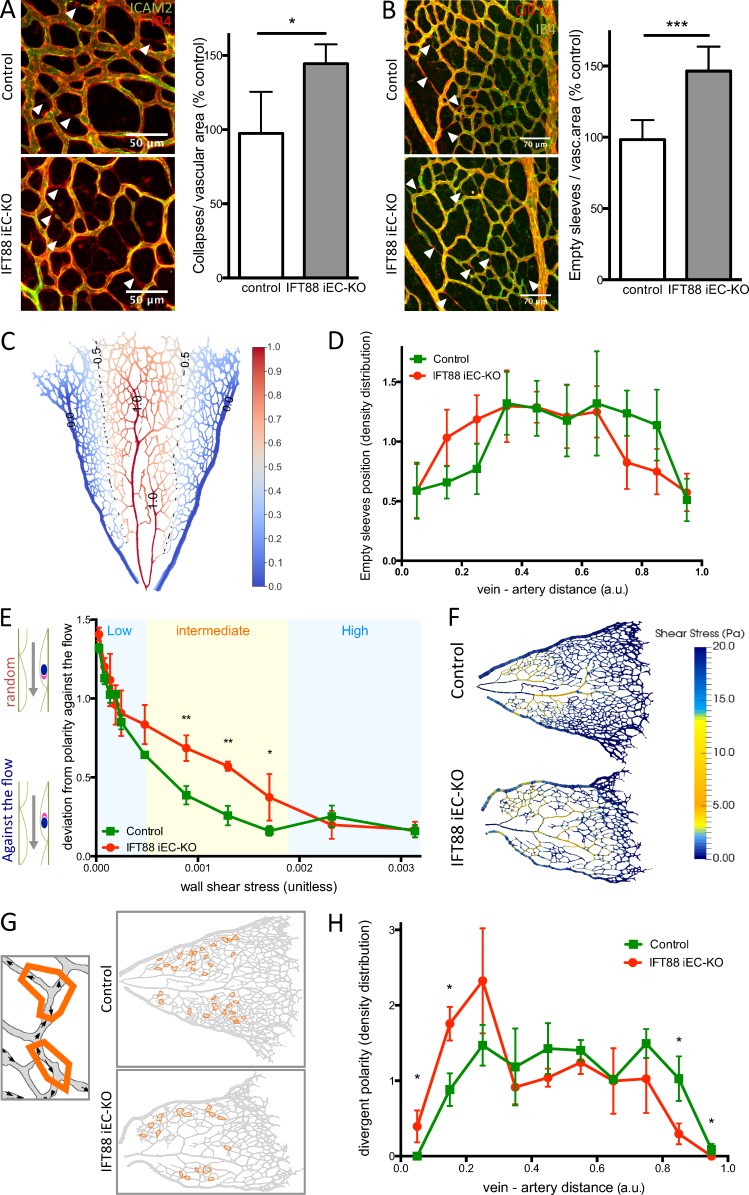
IFT88 iEC-KO mice show increased random vascular regression and loss of flow-induced polarity. (A) Retinas from P6 IFT88 iEC-KO and littermate control mice were stained for ICAM2 (green) and with Isolectin B4 (red). Arrowheads show collapsed vessels. The number of collapsed lumens per vascular area was quantified in both groups (n = 8; median ± IQ; two-sided Wilcoxon test; *, P < 0.05). Bars, 50 µm. (B) Retinas from P6 IFT88 iEC-KO and littermate control mice were stained for Collagen IV (red) and with Isolectin B4 (green). Arrowheads show collagen empty sleeves. The number of empty sleeves was quantified in both groups (WT, n = 9; KO, n = 7; median ± IQ; two-sided Wilcoxon test; ***, P < 0.001). Bars, 70 µm. (C) Representation of the method determining the distance value for elements placed between a vein and an artery (0 = touching the vein, 1 = touching the artery). (D) The distribution of empty sleeves was quantified in IFT88 iEC-KO mice and littermate controls (WT, n = 9; KO, n = 7; mean + SEM; one-sided Mann–Whitney U test). (E) Flow-induced polarity profile depending on shear stress value in the retina of the IFT88 iEC-KO mice compared with littermate controls (n = 3; mean + SEM; 0 = perfect polarity against the flow direction; 1.6 = random polarity; one-sided Mann–Whitney U test; *, P < 0.10; **, P < 0.05). (F) Visualization of simulated shear profiles in P6 IFT88 iEC-KO and littermate control retinas. The color-coding is adjusted to highlight the intermediate shear range where ECs in the KO show reduced polarity (shown in yellow, representative images of six animals). (G) Schematics showing examples of divergent polarity events in the remodelling plexus. Arrows, polarity vectors; orange contours, regions of divergent polarity. (H) The density distribution of divergent polarity events was determined for both IFT88 iEC-KO mice and littermate controls (n = 3; mean + SEM; one-sided Mann–Whitney U test; *, P < 0.10; **, P < 0.05). a.u., arbitrary unit.

