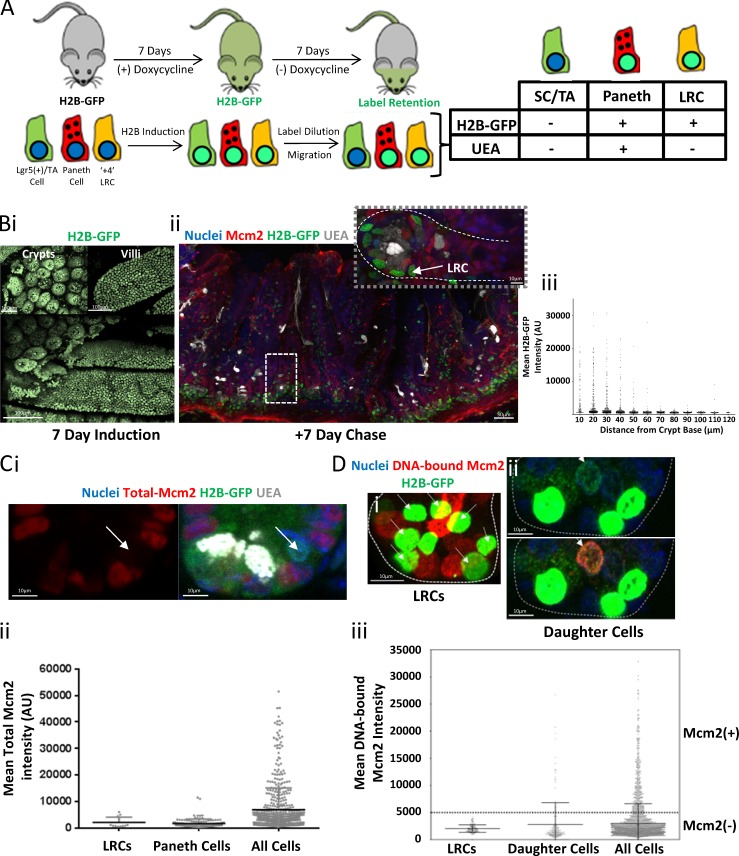
Figure 5.
LRCs are in a deep G0 state. (A) Labeling strategy. H2B–GFP expression was induced in all intestinal epithelial cells in H2B–GFP mice by administration of doxycycline for 7 d. After complete labeling, doxycycline was removed, and mice rested for 7 d. During that chase period, most H2B–GFP+ cells are lost by label dilution because of cell division and upward migration. Both Paneth cells and +4 LRCs are H2B–GFP+ after the chase period. The +4 LRCs were distinguished from Paneth cells by the lack of UEA staining (Buczacki et al., 2013). (B) Representative images of whole-mount sections of H2B–GFP expressing small-intestine tissue after a 7-d labeling period (i). Bars, 100 µm. A vibratome section (ii) of intestinal tissue after a subsequent 7-d chase period, stained with Hoechst (nuclei), UEA (gray), and an antibody against Mcm2 (red). Bars, 50 µm. An enlarged image of the marked crypt is shown. Bar, 10 µm. A UEA− LRC is marked with a white arrow. Quantification of the mean GFP intensity for all cells along the crypt–villus axis is shown after the 7-d chase period (n = 3,525 cells (iii). (C) A representative image (i) of an LRC in an intestinal crypt stained with Hoechst (blue), UEA (white), and an antibody against Mcm2 (red). Bar, 10 µm. The LRCs (white arrows) do not express Mcm2. The quantification of Mcm2 expression in LRCs (n = 12), Paneth cells (n = 116), and all cells (n = 543) is shown (iii). (D) Representative images of extracted H2B–GFP crypts after the 7-d chase period. Bar, 10 µm. H2B–GFPHi cells (bright green) represent Paneth cells and +4 LRCs (i), and H2B–GFPlow cells (faint green) represent daughter cells (white arrows) that have diluted H2B–GFP content because of cell division (ii). The quantification of DNA-bound Mcm2 in GFPHi LRCs (n = 110) and GFPlow daughter cells (n = 186) compared with the total cell population (all cells; n = 3,236) is shown (iii).

