Figure 6.
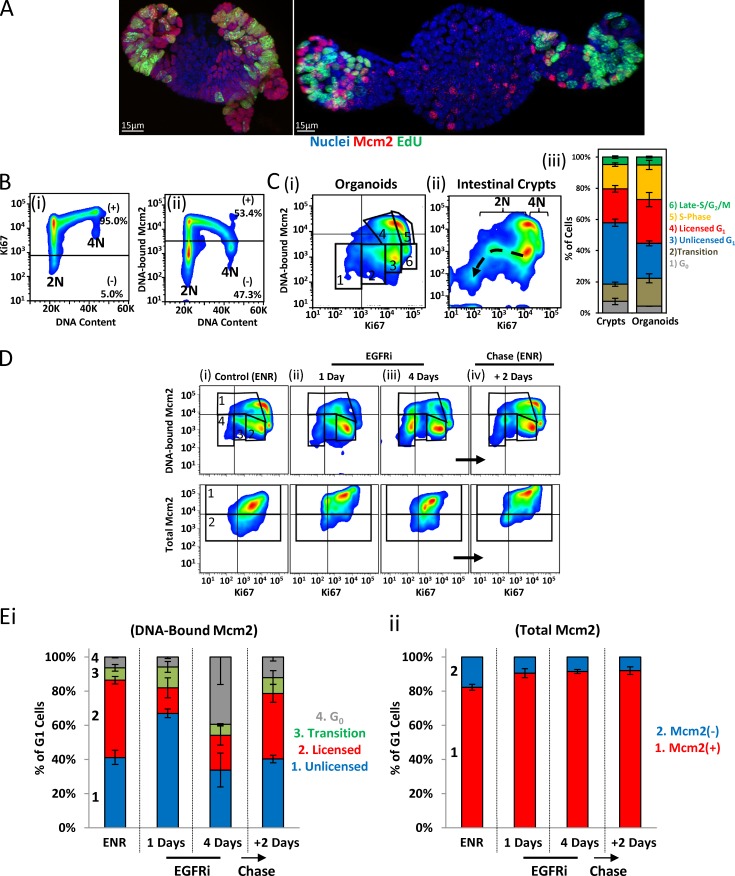
Licensing dynamics in intestinal organoids. (A) Representative image of unextracted and extracted intestinal organoids stained with Hoechst (blue) and an antibody against Mcm2 (red) after a 1-h EdU pulse (green). Bars, 15 µm. (B) Representative flow cytometry profiles from isolated organoid cells showing Ki67 (i) or DNA-bound Mcm2 (ii) content versus DNA content. Data are representative of three independent experiments. (C) Representative flow cytometry profile from cells isolated from cultured organoids (i) or intestinal crypts (ii) showing DNA-bound Mcm2 versus Ki67 (Fig. S5 A). Ki67 loss and subsequent loss of Mcm2 during differentiation is apparent, starting from unlicensed G1 (dashed arrow). Quantification of discrete populations (gates shown in i) was performed: (1) G0, (2) transition (G0 ↔ unlicensed G1), (3) unlicensed G1, and (4) licensed G1, (5) S phase, and (6) late S/G2/M (n = 3) with means ± SEM displayed. (D) Representative flow cytometry profiles of isolated organoid epithelial cells grown in ENR (control) and treated with the EGFR inhibitor gefitinib for the indicated times (i–iii). After 4 d in gefitinib, organoids were reactivated by removal of the gefitinib and readdition of fresh growth factors (ENR) for 2 d (iv). Displayed are profiles comparing DNA-bound Mcm2 versus Ki67 (top) or total Mcm2 content (bottom). Data are representative of three independent experiments. (E) The G1 cell populations, as shown in D, were quantified. DNA-bound Mcm2 profiles (i) show (1) unlicensed G1, (2) licensed G1, (3) transition (G0 ↔ unlicensed G1), and (4) G0 populations. Total-Mcm2 profiles (ii) show Mcm2-expressing, i.e., Mcm2+, and nonexpressing, i.e., Mcm2−, cells (n = 3). Data are displayed as percentage means ± SEM.

