Figure 3.
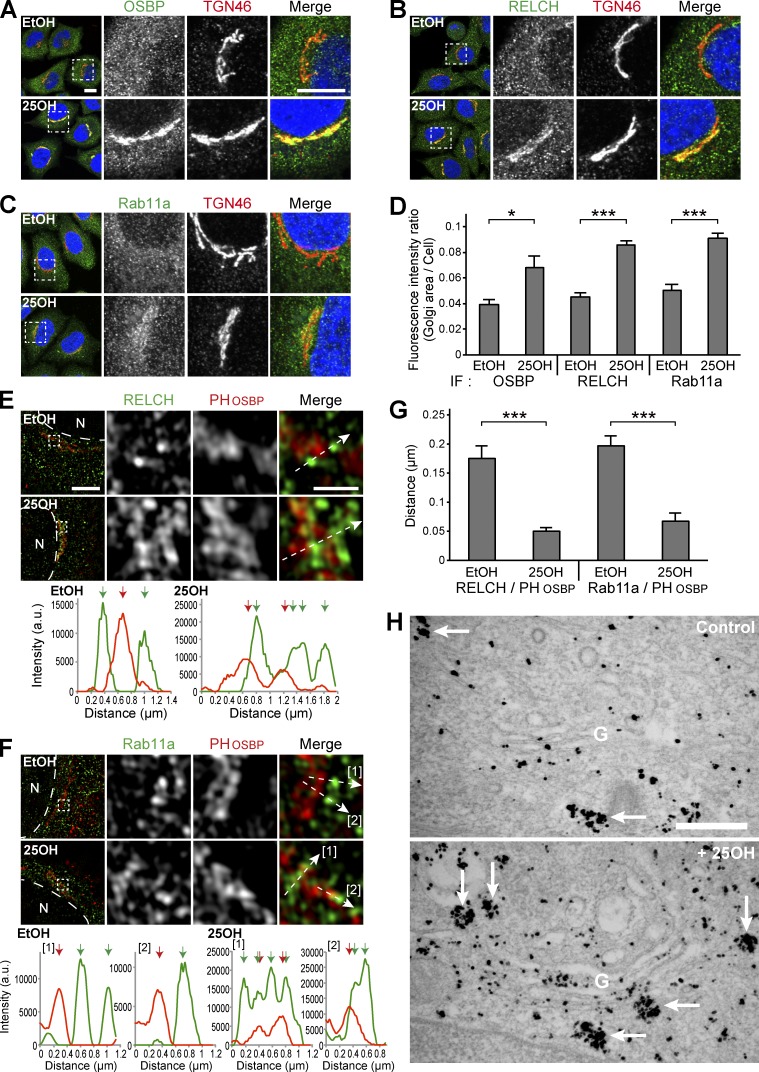
Localization of RELCH, OSBP, and Rab11 after 25-OH treatment. (A–D) HeLa cells were incubated with 6.2 µM 25-OH or solvent (ethanol, EtOH) for 24 h and immunostained with antibodies against TGN46 and OSBP (A), RELCH (B), or Rab11a (C). The nuclei were stained with DAPI (blue). The enlarged images show the TGN area. Bar, 10 µm. (D) Quantification of the ratio of the fluorescence intensity in the Golgi area to the intensity in the whole intracellular area (n = 10–25 cells). (E–G) HeLa cells transfected with the Flag-tagged PH domain of OSBP (PHOSBP) were incubated with EtOH or 25-OH for 24 h before analysis. The cells were immunostained with antibodies against Flag and either RELCH (E) or Rab11a (F) and imaged by SR-SIM. The fluorescence intensity profiles of PHOSBP and either RELCH or Rab11a were measured at the position marked by the arrows in the merged insets. The red and green arrows in the graphs indicate the intensity peak of PHOSBP and RELCH or Rab11a, respectively. N, nucleus. Bars: (main images) 5 µm; (enlarged images) 1 µm. (G) Quantification of the distance between the intensity peak of PHOSBP and RELCH or Rab11a (n = 15–34 cells). (H) Immunoelectron microscopy of HeLa cells treated with 25-OH and nontreated control cells after the EGFP-Rab11a transfection. Silver-enhanced gold particles were used to label the EGFP-Rab11a–positive vesicles and tubules (arrows). Bar, 500 nm. Data are expressed as means ± SEM. Significance was calculated by performing two-tailed Student’s t tests (*, P < 0.05; ***, P < 0.001). IF, immunofluorescence.

