Figure 4.
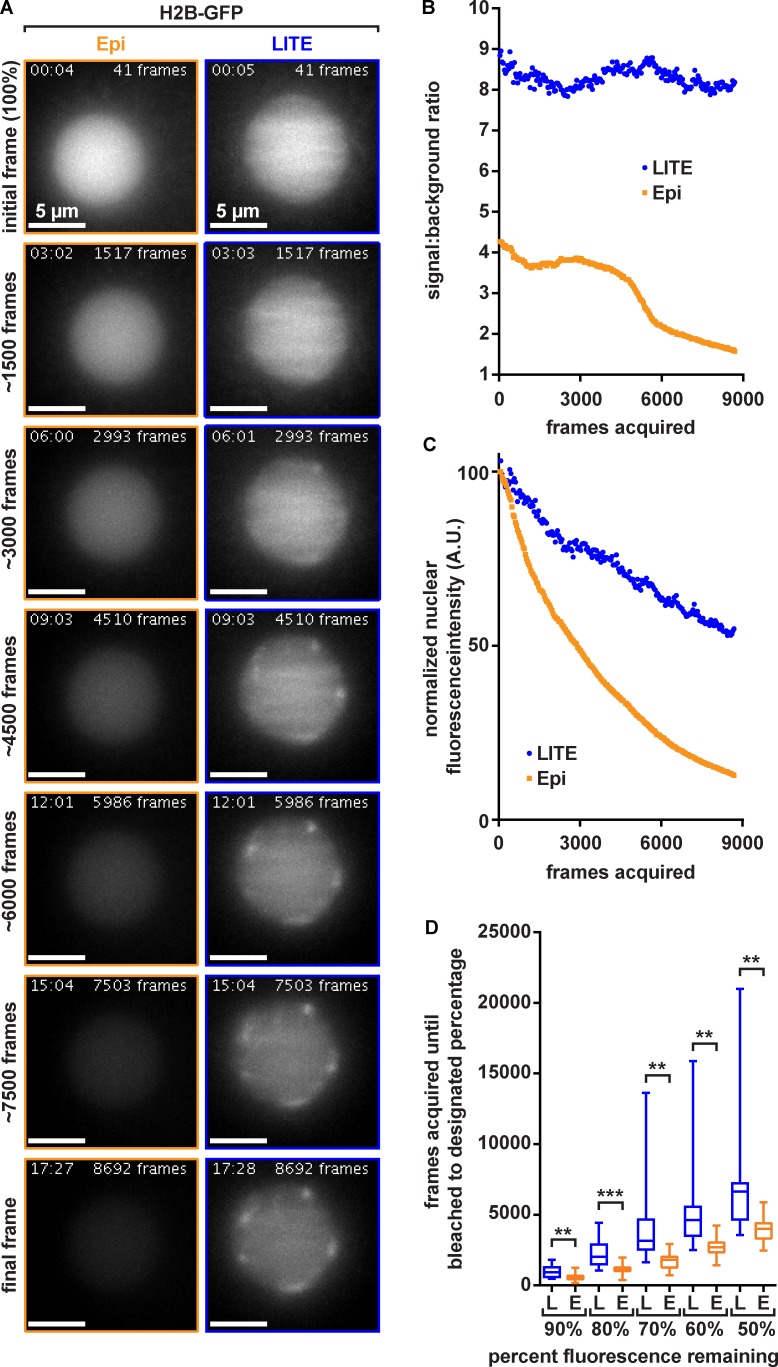
Quantification of LITE photobleaching rates. (A) Representative image sets of C. elegans embryos expressing GFP-tagged histone H2B construct to visualize nuclei. Representative images show P1 nucleus. All images were taken by using the same 60× 1.4-NA oil-immersion objective with a frame exposure time of 100 ms, a z-step size of 0.5 µm, a z range of 20 µm, and no delay between time points. Images shown are z maximal-intensity projections. Lengths of time the nuclei were exposed to the laser (LITE) or arc lamp (epi-illumination) are denoted in the upper left-hand corner of each image in the format of minutes:seconds. Cumulative number of frames acquired up until displayed images were acquired is denoted in the upper right-hand corner of each image. Rows represent images of the nuclei (internally scaled to initial frame of each nucleus) taken after the denoted number of frames (left of rows). (B) Measured SBRs of LITE and epi-illumination of nuclei shown in A. (C) The raw integrated density values of the nuclear regions-of-interest for LITE and epi image sets represented in A. (D) Box-and-whiskers plots of all nuclei (n ≥ 16), illustrating the number of frames acquired before nuclei bleached to 90, 80, 70, 60, and 50% intensities for both LITE (L; blue boxes) and epi-illumination (E; orange boxes). LITE significantly increases the number of frames that can be acquired before fluorescent nuclei bleach to 90, 80, 70, 60, and 50% of their original intensities (P < 0.01).

