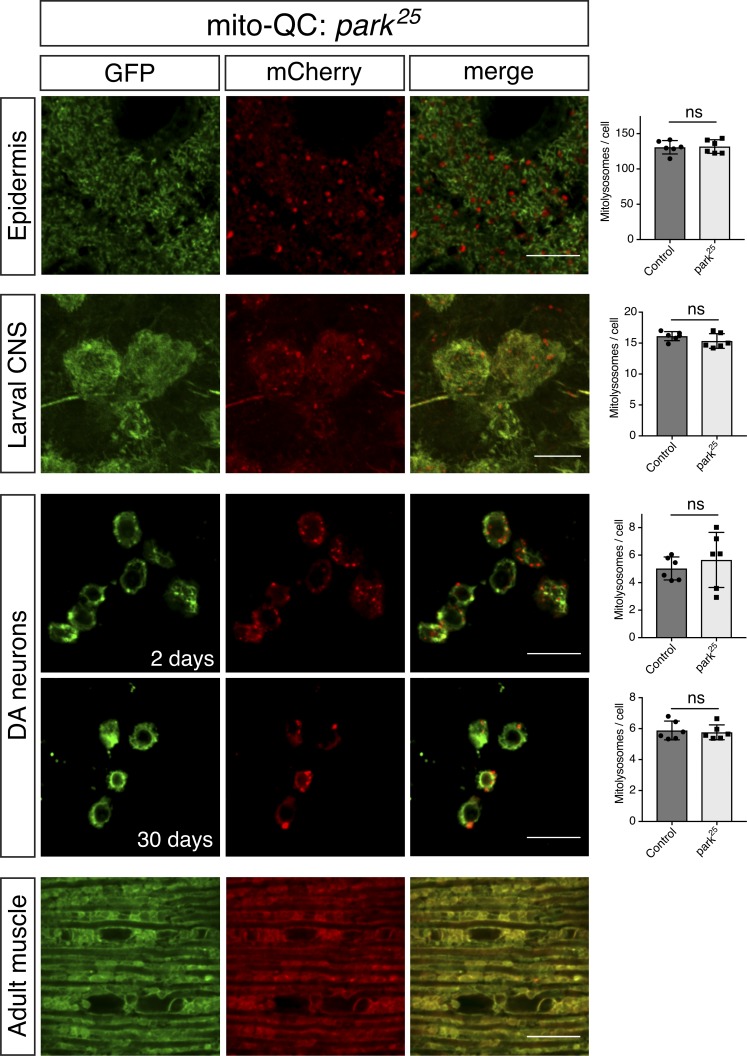
Figure 5.
Basal mitophagy is minimally affected in parkin mutants. Confocal microscopy analysis of mito-QC reporter in park25 larval epidermis and CNS, DA neurons at 2 and 30 d old, and adult flight muscle (2 d old), as indicated. Mitolysosomes are evident as GFP-negative/mCherry-positive (red-only) puncta. Bars, 10 µm. Charts show quantification of mitolysosomes and show mean ± SD of n = 6 animals. Quantification of WT control samples is the same as shown in Figs. 1 and 4. Number of cells analyzed: epidermis, WT = 29 cells, park25 = 30 cells; larval CNS, WT = 28 cells, park25 = 31 cells; DA neurons 2 d, WT = 100 cells, park25 = 69 cells and 30 d, WT = 78 cells, park25 = 83 cells. Statistical significance determined by Welch’s t test; ns = nonsignificant. Genotypes analyzed were park25,da-GAL4/park25,UAS-mito-QC (epidermis and larval CNS), UAS-mito-QC; park25,TH-GAL4/park25 (DA neurons), and park25,Mef2-GAL4/park25,UAS-mito-QC (adult muscle).

