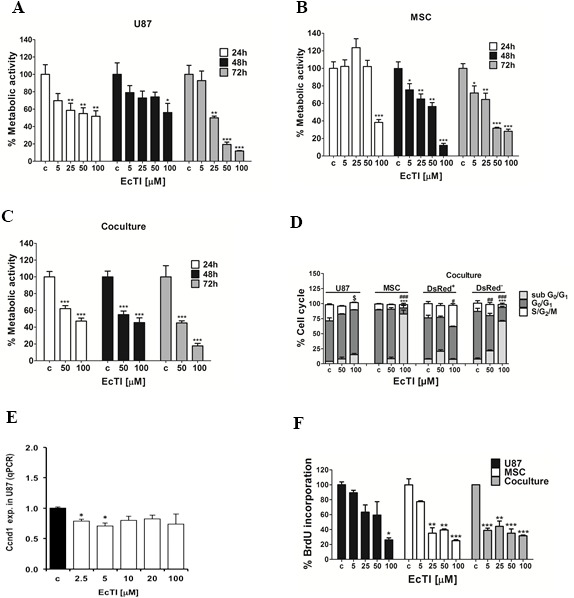
Figure 1. Effects of EcTI on cell metabolic activity and proliferation.

EcTI affects the viability of U87 cells in GBM (A); MSCs (B); and coculture (C). Cells were treated with increasing concentrations of EcTI (5, 25, 50, and 100 μM) for 24 and 48 h and their viability was determined by metabolic rate using the MTT assay. Absorbance values were measured at 540 nm and normalized to the control of non-treated cells (c). Cell cycle percentage after EcTI treatment (50 and 100 μM) for 24 h (D). Statistical analysis represents the relation between control (c) and EcTI concentrations, considering the symbol (*) for statistical within sub G0/G1, (#) G0/G1, ($) S/G2/M. (E) mRNA levels of CcDN1 in U87 cells treated with EcTI (2.5, 5, 10, 20, and 100 μM) for 72 h and presented relative to control non-treated U87 cells; (F) Effects of EcTI on the proliferation of MSC and U87 cells, and coculture with increasing EcTI concentrations. The percentage was measured by the ratio between treated and control cells. Error bars represent SD. *p < 0.05, **p< 0.005, ***p< 0.0005 were considered significant in the statistical analysis performed by the Tukey's test and one-way ANOVA.
