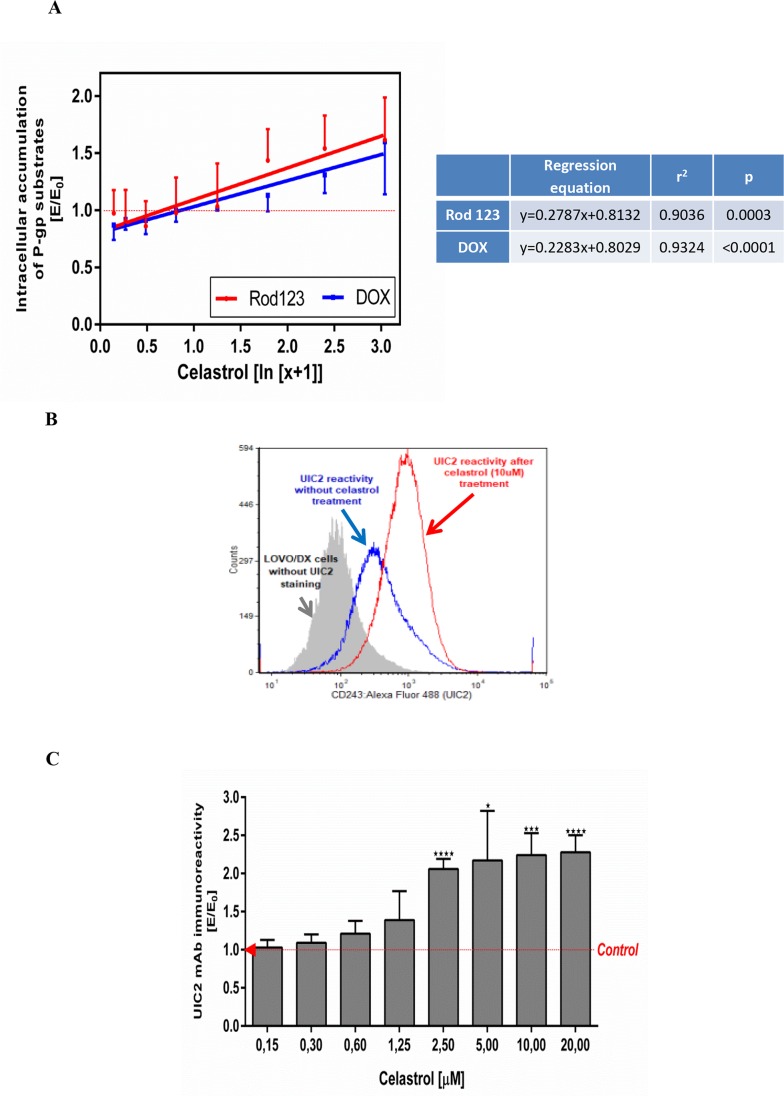
Figure 3. Influence of celastrol on P-gp structure and transport function in LOVO/DX cell cultures.
(A) Accumulation of doxorubicin (DOX) and rhodamine 123 (Rod-123) in colon cancer cells. The cells (5×10⁵/ml) were pre-incubated (5min) with celastrol following by incubation with DOX (3μM) or Rod-123 (5μM) [1h, 37°C]. The cells-associated fluorescence was evaluated by flow cytometry. The result obtained in the presence of celastrol (E) were compared to the relevant control culture (E0), i.e. LOVO/DX culture (without celastrol) and expressed as E/E0 ratios. The dose-dependent effects were calculated with regression equations. (mean±SD; n=4 (DOX) and n=8 (Rod-123)). (B) Representative histograms of the UIC2 mAb immunoreactivity with Pgp in LOVO/DX cell cultures treated with 10μM of celastrol (red line) or with diluent only (DMSO, blue line). The cells were incubated with celastrol [10min., 37°C] and then stained with anti-CD243 Alexa Fluor 488 (UIC2 mAb) celastrol [15min., 37°C]. The cells-associated fluorescence was evaluated by flow cytometric analysis (C) Immunoreactivity of the UIC2 mAb with Pgp after LOVO/DX cell culture treatment with the range of celastrol concentrations. Results are expressed as E/E0 ratios (mean±SD, n=4; *p<0.05, ***p≤0.0001), where MFI (mean fluorescence intensity) of the UIC2 mAb estimated in cell cultures incubated with celastrol (E) were compared to MFI of the UIC2 mAb of cells cultured in the presence of DMSO (E0).

