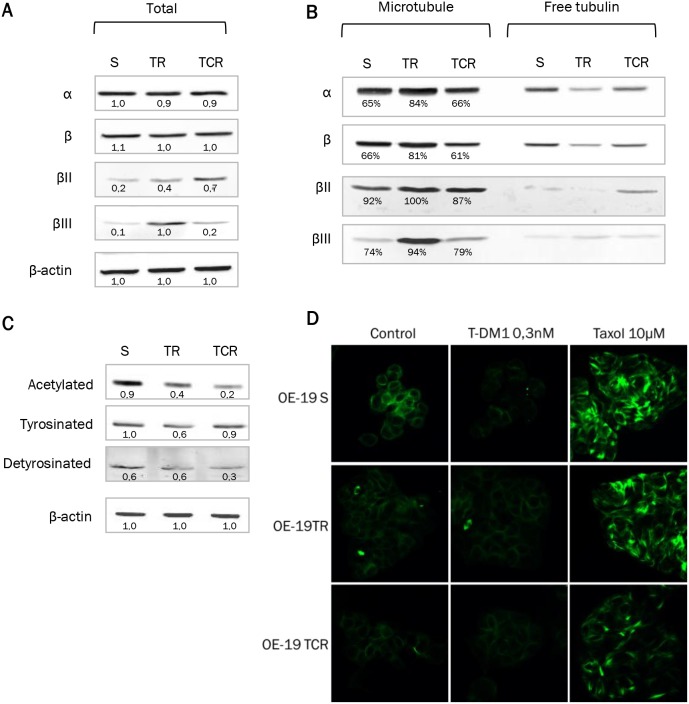
Figure 5. Tubulin expression and polymerized/soluble tubulin fractions in resistant models.
Expression of total α and β tubulin and isoforms βII and βIII was examined from total cell lysates or from purified fractions of tubulin. A single experiment is shown, representative of 3 experiments. (A) Protein levels from total cell lysate were studied by Western Blot and the density of the bands was normalized with actin to determine the expression fold-change. Cells resistant to T-DM1 express higher levels of βII and βIII tubulin than parental cells. (B) Protein expression after purification of polymerized (microtubule fraction) and soluble (free tubulin fraction) tubulin. The percentage of polymerized tubulin indicated on the Supplementary Figure hows that TR cells have an increased amount of polymerized tubulin compared to parental. (C) Acetylation, tyrosination and detyrosination state of α tubulin was studied by Western Blot. (D) Immunostaining of tubulin was performed in parental and resistant cells with or without exposure to T-DM1. Exposure to Taxol is shown as a positive control. Tubulin staining shows that the tubulin network is less sensitive to disruption by T-DM1 in resistant cells that sensitive cells.

