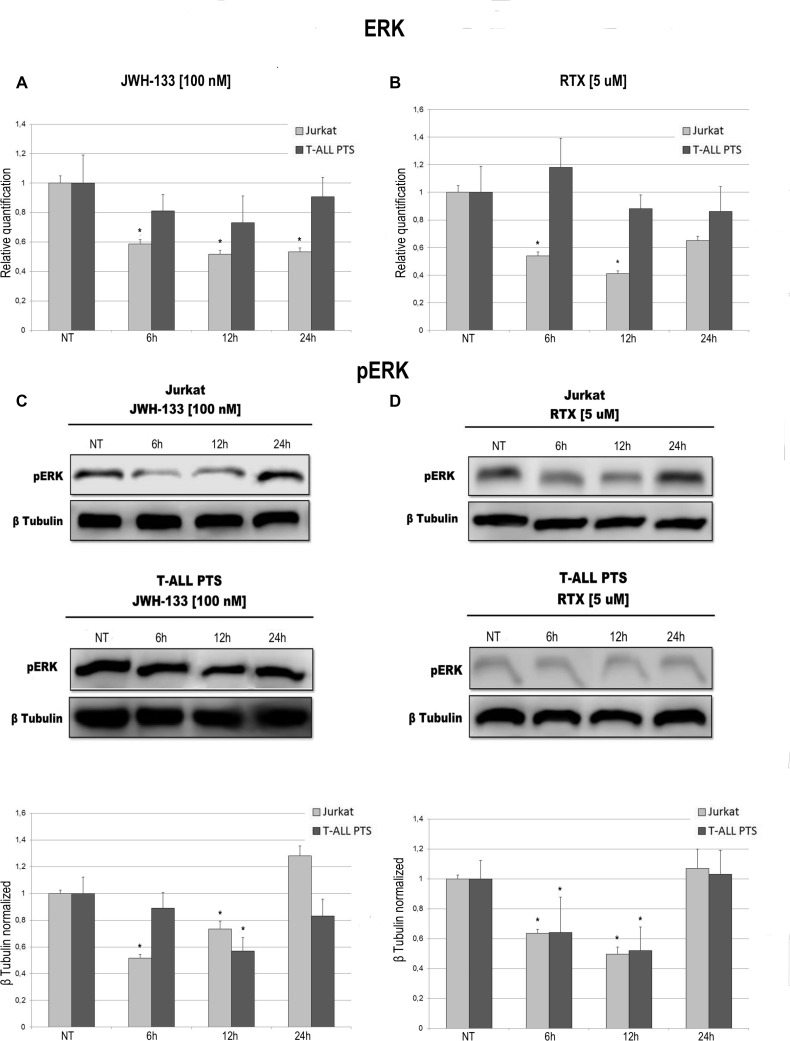
Figure 4. Effects of JWH-133 and RTX treatments on ERK mRNA expression levels and pERK protein expression levels.
ERK mRNA expression levels in Jurkat cell line and in T-ALL patients’ lymphoblasts derived from 4 patients were determined by Q-PCR after JWH-133 [100 nM] (A) and RTX [5 uM] (B) treatments at 6 h, 12 h and 24 h of exposure. Results were normalized for the housekeeping gene β-actin and were showed as mean ± SD of three independent experiments for Jurkat cells (performed in technical triplicate), and as mean ± SD of four single experiments on each one of the 4 patients (performed in technical triplicate). A t-test has been used to evaluate statistical differences in ERK expression among groups. *indicates p ≤ 0.05 compared to the untreated control (NT). pERK protein expression levels in Jurkat cell line and in T-ALL patients’ lymphoblasts, were determined by Western Blot, starting from 15 μg of total lysates after JWH-133 [100 nM] (C) and RTX [5 uM] (D) treatments after 6 h, 12 h and 24 h of exposure. Images show the most representative blots. The proteins were detected using Image Studio Digits software and the intensity ratios of immunoblots compared to the untreated control, taken as 1(arbitrary unit), were quantified after normalizing with respective loading controls for the housekeeping protein β-tubulin. The results were normalized for the housekeeping protein β-tubulin. The graphs represent the relative quantification for pERK expression as mean ± SD from two independent experiments for Jurkat cells and as mean ± SD of four single experiments on each one of the 4 patients. A t-test has been used to evaluate the statistical differences in protein expression levels. *indicates p ≤ 0.05 compared to the untreated control (NT).

