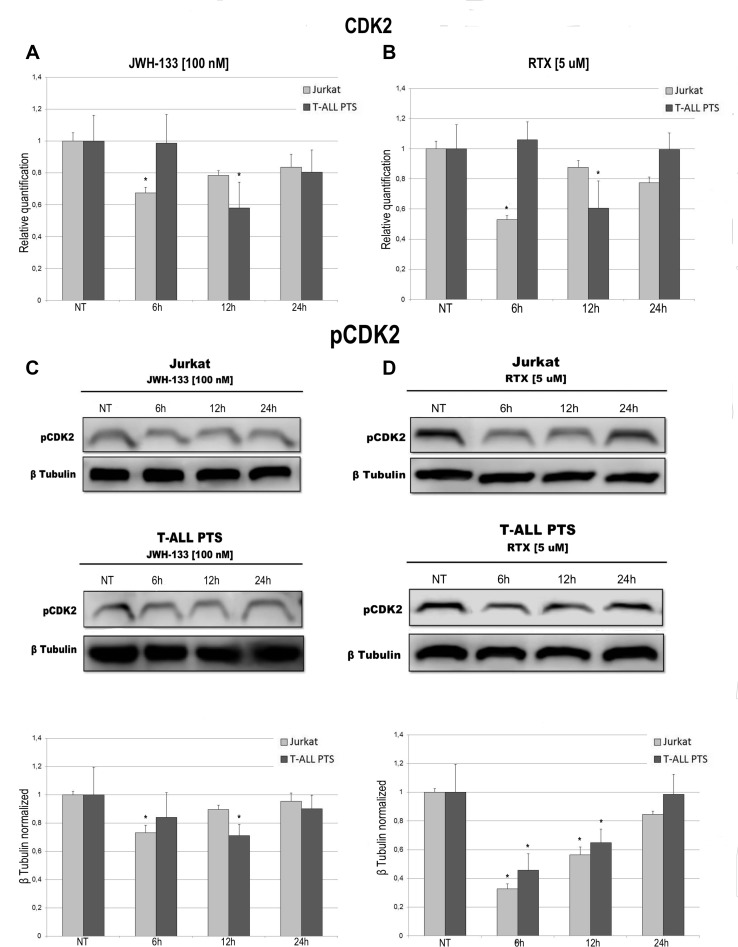
Figure 6. Effects of JWH-133 and RTX treatments on CDK2 mRNA expression levels and pCDK2 protein expression levels.
CDK2 mRNA expression levels in Jurkat cell line and in T-ALL patients’ lymphoblasts derived from 4 patients were determined by Q-PCR after JWH-133 [100 nM] (A) and RTX [5 uM] (B) treatments at 6 h, 12 h and 24 h of exposure. Results were normalized for the housekeeping gene β-actin and were showed as mean ± SD of three independent experiments for Jurkat cells (performed in technical triplicate), and as mean ± SD of four single experiments on each one of the 4 patients (performed in technical triplicate). A t-test has been used to evaluate statistical differences in CDK2 expression among groups. *indicates p ≤ 0.05 compared to the untreated control (NT). pCDK2 protein expression levels in Jurkat cell line and in T-ALL patients’ lymphoblasts, were determined by Western Blot, starting from 15 μg of total lysates after JWH-133 [100 nM] (C) and RTX [5 uM] (D) treatments after 6 h, 12 h and 24 h of exposure. Images show the most representative blots. The proteins were detected using Image Studio Digit software and the intensity ratios of immunoblots compared to that of untreated control, taken as 1 (arbitrary unit), were quantified after normalizing with respective loading controls for the housekeeping protein β-tubulin. The graphs represent the relative quantification for pCDK2 expression as mean ± SD of two independent experiments for Jurkat cells and as mean ± SD of four single experiments on each one of the 4 patients. A t-test has been used to evaluate the statistical differences in protein expression levels. *indicates p ≤ 0.05 compared to the untreated control (NT).

