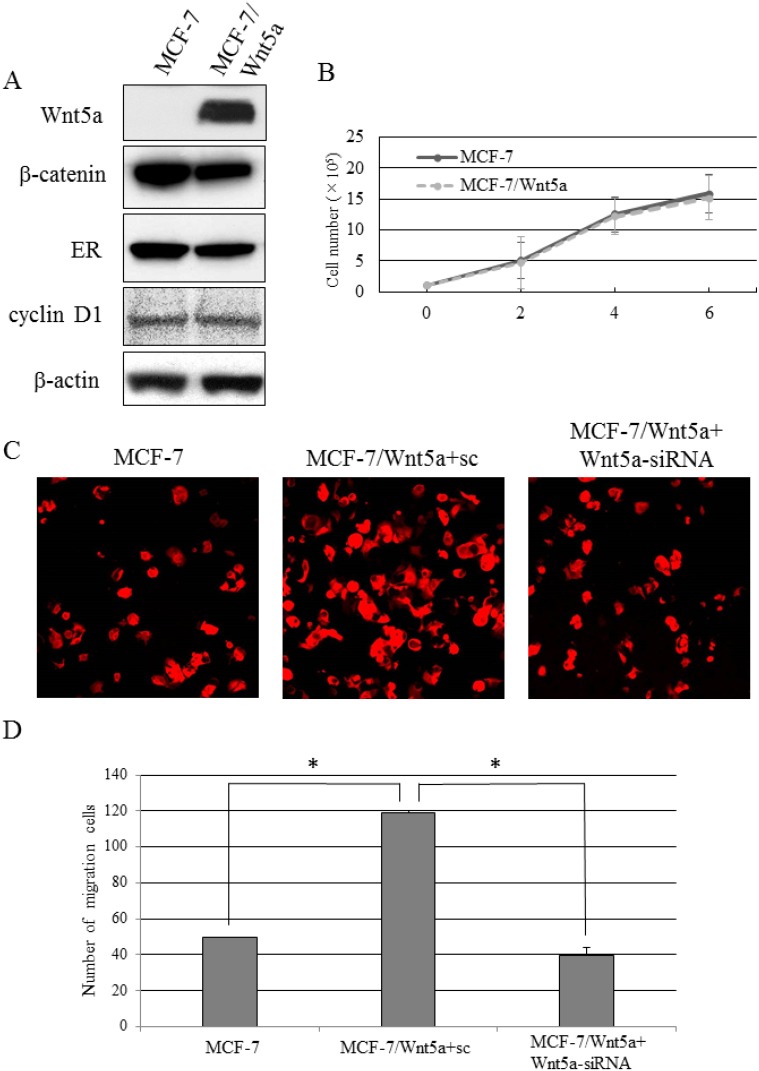
Figure 3. Migratory capacity of Wnt5a-expressing breast cancer cells.
(A) The expression levels of β-catenin, ER, and cyclin D in MCF-7/Wnt5a and control MCF-7 cells. (B) The proliferative capacity in MCF-7/Wnt5a and control MCF-7 cells. Data are presented as the mean ± SE of three proliferation assays. (C, D) The migratory capacity of MCF-7, MCF-7/Wnt5a + sc, and MCF-7/Wnt5a + Wnt5a-siRNA cells. Data are presented as the mean ± SE of three migration assays. Data were evaluated using the Mann–Whitney U-test.

