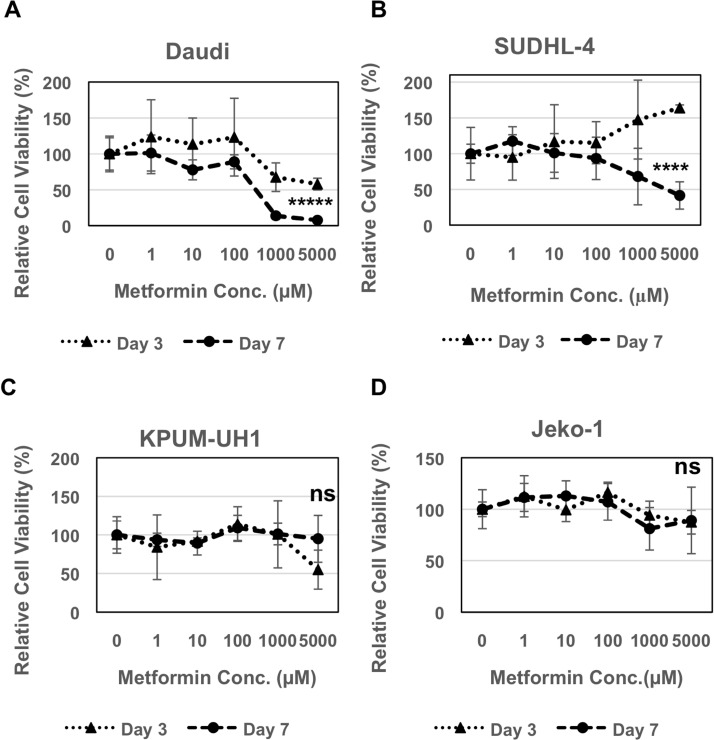
Figure 1. Metformin reduces viability of lymphoma cells.
2000 cells (A Daudi, B SUDHL-4, C KPUM-UH1, D Jeko-1) were plated in each well of a 96 well plate and treated with different concentrations of metformin (0 μM, 1 μM, 10 μM, 100 μM, 1000 μM, 5000 μM: 5 replicates per condition). Cells were pelleted, washed once with 1X PBS and frozen at day 3 and 7. The number of cells were quantified using Hoechst 33342 DNA-binding dye after multiple freeze-thaw cycles to lyse the cells. Fluorescence reading of Hoechst 33342 at 0 μM on all days was set to 100% and was used to normalize the rest of the data. Error bars represent standard deviation between replicates. p values between 0 μM vs. 5000 μM on day 7 is shown. *****p value < 0.0001; ****p value = 0.0005; ns = not significant.

