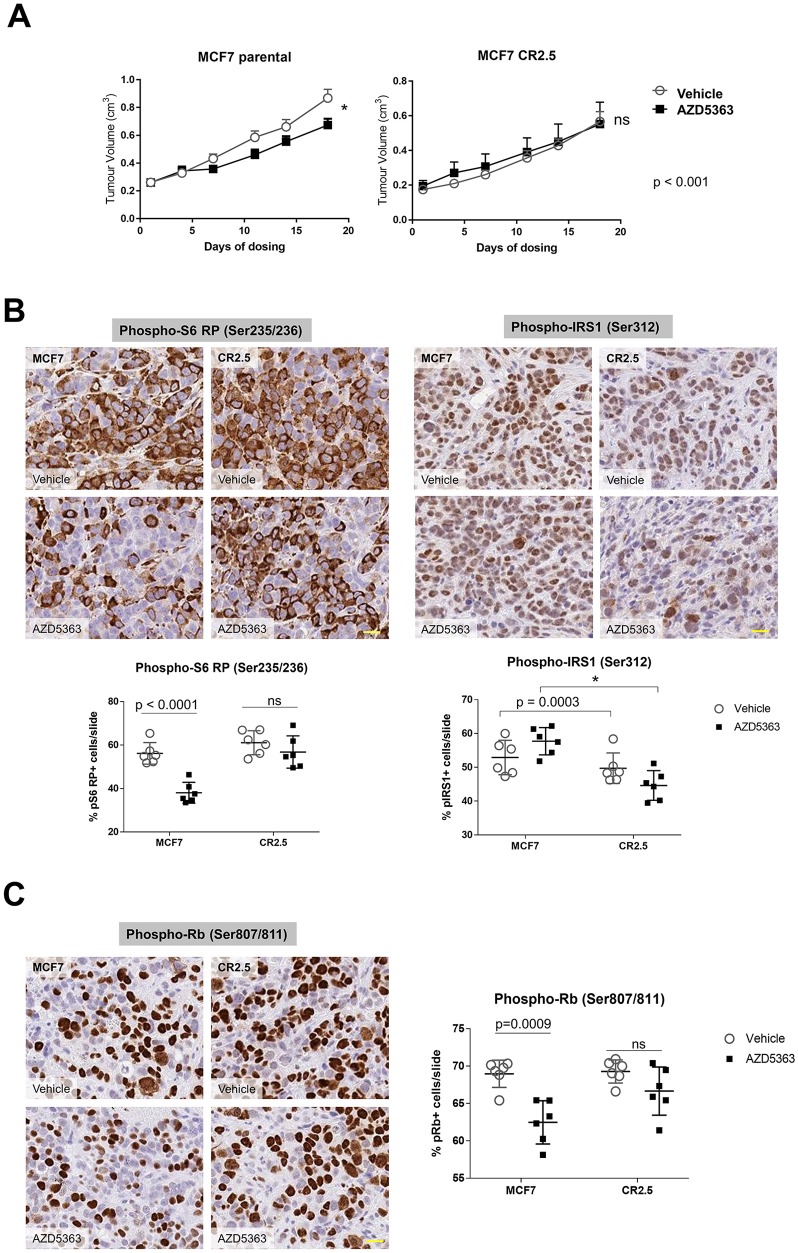
Figure 4. MAP3K1-deficient tumors are resistant to AZD5363 treatment.
(A) Quantification of tumor volume following vehicle or AZD5363 treatment in MCF7 parental (upper left panel) versus MCF7 CR2.5 (upper right panel) xenograft after 18 days dosing. P-values were determined by the Student's t-test. (B and C) Representative immunostainings of phospho-S6 RP, phospho-IRS1 (B) and phospho-Rb (C) markers in MCF7 parental and MCF7 CR2.5 xenografts sections from xenograft tumors. Scale bars (yellow) represent 20 μm. Graphs show analysis and quantification of positive events using HALO (indica labs). The resulting algorithm was applied to the whole slide (n = 6) (see Supplementary Figure 4 for more details). P-values were determined by the Student's t-test.

