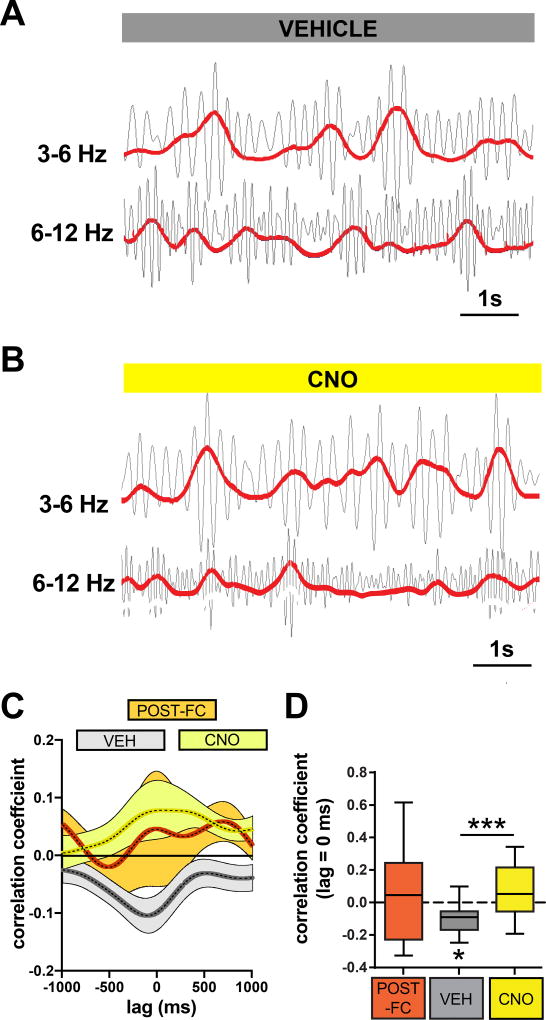
Figure 4. BLA PV-interneurons enable competition between 3–6 Hz and 6–12 Hz oscillations.
A–B) Examples of 3–6 Hz and 6–12 Hz filtered traces indicate a negative correlation between the instantaneous powers of these two bands in a vehicle-injected mouse, and a positive correlation in a CNO-injected mouse. C) Averaged cross-correlograms were calculated for POST-FC, VEH, and CNO conditions (see experimental design in Fig. 3A). D) Quantification of the correlation coefficient at 0 lag revealed a significant negative correlation between the 3–6 Hz and 6–12 Hz bands after extinction in VEH injected mice (VEH One sample t-test with theoretical mean = 0: t(10) = 3.131, P = 0.0107, n = 11 mice), which was eliminated by CNO injection (VEH versus CNO Paired t-test: t(10) = 4.746, P = 0.0008, n = 11 mice). There was no significant negative or positive correlation before extinction or following CNO injection (POST-FC One sample t-test with theoretical mean = 0: t(8) = 0.4696, P = 0.6512, n = 9 mice; CNO One sample t-test with theoretical mean = 0: t(10) = 1.636, P = 0.1329, n = 11 mice). Box plot graph shows median (line inside box), 25% and 75% percentiles (box edges), and minimum and maximum values (error bars).

