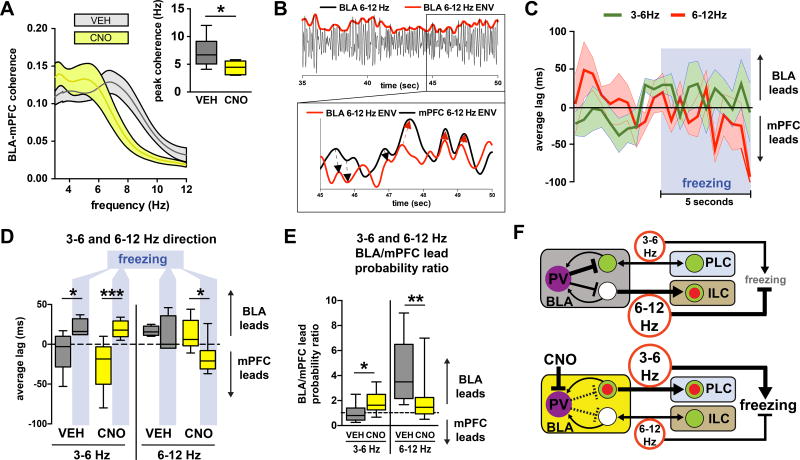
Figure 7. BLA PV-interneurons control directionality of 3–6 and 6–12 Hz oscillations following extinction.
A) Silencing BLA PV-interneurons during post-extinction retrieval shifts BLA-mPFC peak coherence towards the 3–6 Hz range (paired t-test: t(8) = 2.486, P = 0.0378, n = 9 mice). B) Example of a 6–12 Hz filtered trace demonstrating the extraction of instantaneous power envelopes (top) which can be cross-correlated (bottom) to determine leading (black arrows) or lagging (red arrows) relationships between two signals. C) Averaged lags from instantaneous power cross-correlations for both 3–6 Hz and 6–12 Hz bands during the 5 seconds preceding and the 5 seconds following the onset of freezing during retrieval trials (VEH n= 6 mice, CNO n = 8 mice, 1 freezing event per mouse per trial). D) The first 5 seconds following the onset of freezing is characterized by a shift towards a BLA lead for 3–6 Hz in both VEH and CNO groups (repeated measures two-way ANOVA: freezing F(1,11) = 29.12, P = 0.0002, CNO F(1,11) = 1.013, P = 0.3357, freezing×CNO F(1,11) = 1.411, P = 0.2598, VEH n = 5 mice, CNO n = 8 mice; Sidak's multiple comparisons test: pre-freeze vs freeze for VEH t(11) = 2.682, P = 0.0422; Sidak's multiple comparisons test: pre-freeze vs freeze for CNO t(11) = 5.308, P = 0.0005), and a shift towards a mPFC lead for 6–12 Hz in the CNO group (repeated measures two-way ANOVA: freezing F(1,9) = 5.487, P = 0.0439, CNO F(1,9) = 2.263, P = 0.1668, freezing×CNO F(1,9) = 2.355, P = 0.1592, VEH n = 4 mice, CNO n = 7 mice; Sidak's multiple comparisons test: pre-freeze vs freeze for VEH t(9) = 0.5063, P = 0.8593; Sidak's multiple comparisons test: pre-freeze vs freeze for CNO t(9) = 3.215, P = 0.0210). E) Silencing PV interneurons during post-extinction retrieval increased the probability of BLA leading mPFC in the 3–6 Hz band (paired t-test, t(9) = 2.303, P = 0.0468, n = 10 mice), while decreasing the probability that it will lead in the 6–12 Hz band (Wilcoxon matched-pairs: W = −45, P = 0.0039, n = 9 mice). F) Model based on our data and previous studies. Top: after extinction learning, BLA PV-interneurons suppress conditioned freezing and fear ensemble activation by enabling a 6–12 Hz oscillation to out-compete a 3–6 Hz oscillation throughout the BLA-mPFC circuit. Bottom: chemogenetic silencing of BLA PV-interneurons causes dysfunctional competition between the 6–12 and 3–6 Hz oscillations, which leads to an increase in 3–6 Hz power and BLA→mPFC directionality, an increase in the activation of fear ensembles in BLA and PLC, and an increase in conditioned freezing. All box plot graphs show median (line inside box), 25% and 75% percentiles (box edges), and minimum and maximum values (error bars).

