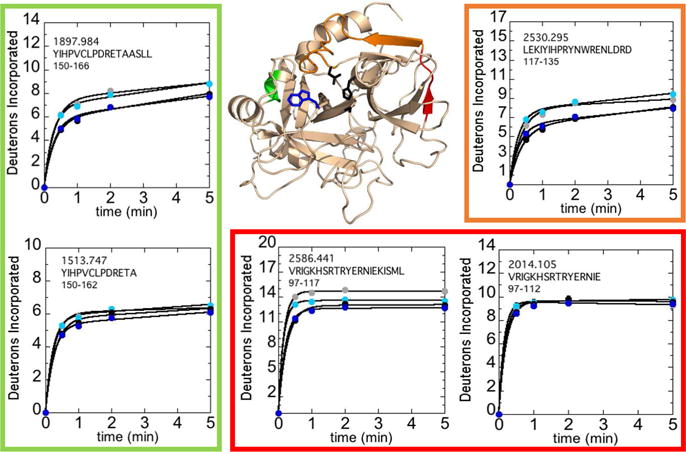
Figure 2.

Structure of WT thrombin (PDB 1PPB) highlighting residues 81-85CT (residues 113-117; red), residues 86-102CT (residues 118-135; orange), and residues 129A-130CT (residues 163-166; green). Colored residues specify regions affected by the concentration of NaCl after subtraction of deuteron uptake of overlapping peptides 66-80CT (residues 97-112; MH+ 2014.105) from 66-85CT (residues 97-117; MH+ 2586.441) and 117-129CT (residues 150-162; MH+ 1513.747) from 117-130CT (residues 150-166; MH+ 1897.984) as well as residues 85-102CT (residues 117-135; MH+ 2530.295). The sidechains of Trp215CT (blue) and the catalytic triad (black) are shown as sticks. Deuteron incorporation into these residues over 5 min is shown for WT thrombin at 100 mM NaCl (grey) and 300 mM NaCl (black), and for the W215A mutant at 100 mM NaCl (cyan) and 300 mM NaCl (blue).
