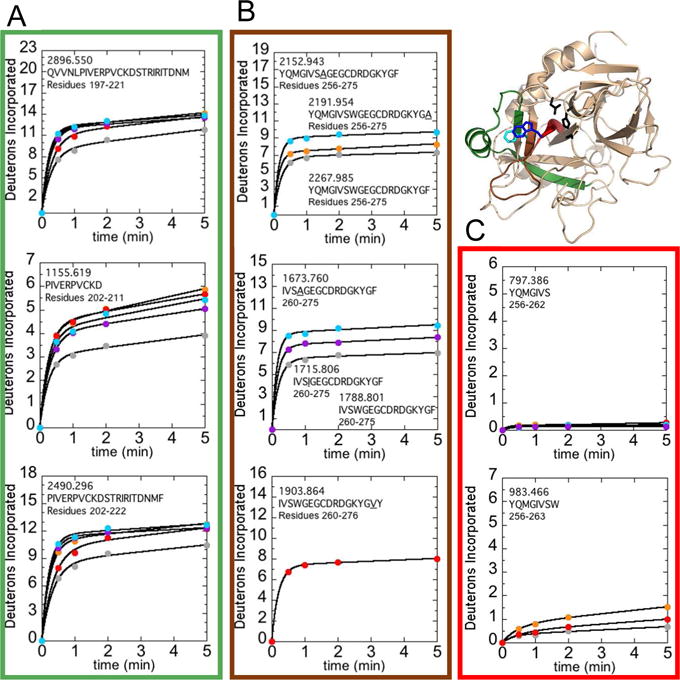
Figure 5.

Structure of WT thrombin (PDB 1PPB) highlighting residues 156-181CT (residues 197-222; green), residues 208-215CT (residues 256-263; red), and residues 216-228CT (residues 264-276; brown). The sidechains of Trp215CT (blue), Phe227CT (cyan), and the catalytic triad (black) are shown as sticks. A) Uptake plots corresponding to residues 156-180CT (residues 197-221; MH+ 2896.550), 161-170CT (residues 202-211; MH+ 1155.619), and 161-181CT (residues 202-222; MH+ 2490.296). B) Uptake plots corresponding to residues 208-227CT (residues 256-275; MH+ 2152.943, MH+ 2191.954, and MH+ 2267.985 for W215A, F227A, and WT respectively), residues 212-227CT (residues 260-275; MH+ 1673.760, MH+ 1715.806, and MH+ 1788.801 for W215A, W215I, and WT respectively), and residues 212-228CT (residues 260-276; MH+ 1903.864 for F227V). The mutant residue, if present, is underlined in the peptide sequence shown. C) Uptake plots corresponding to residues 208-214CT (residues 256-262; MH+ 797.386) and 208-215CT (residues 256-263; MH+ 983.466). Deuterium incorporation over 5 min into the multiple peptides that cover these regions are shown for WT thrombin (grey) as well as the F227A (orange), F227V (red), W215A (cyan), and W215I (purple) mutants under experimental conditions of 100 mM NaCl.
