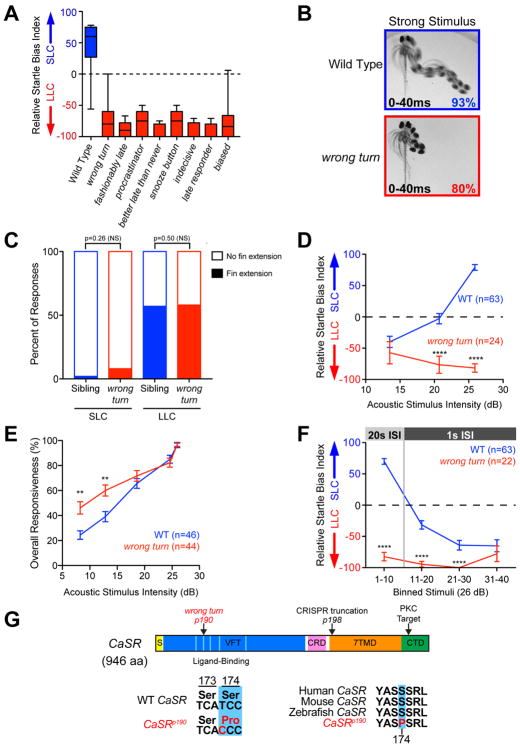
Figure 2. Isolation of decision-making mutants from a forward genetic screen.
(A) Average startle biases of decision-making mutants, presenting average bias of the “bottom 25%” of all tested larvae from heterozygous mutant carrier incrosses (n≥47 mutant larvae each), with the bottom 25% of representative wild type larvae (TLF, blue n=28).
(B) Temporal projection over 40 ms post-stimulus (26 dB) of wild type and wrong turn mutant 5 dpf larval responses. Percentage indicates average frequency observed (30 WT and 58 wrong turn larvae). See also Figure S3.
(C) Percent of short- and long-latency responses using pectoral fins during the initial C-bend. N=14 sibling (blue, 250 responses),14 wrong turn (red, 112 responses), Fishers Exact Test.
(D–E) Acoustic stimulus intensity vs average relative startle index (D) or average overall startle responsiveness (E) for wild type (blue) and wrong turn mutants (red).
(F) Average relative startle bias of 5 dpf wrong turn and wild type larvae following identical 26 dB stimuli at 20 sec intervals (Stimuli 1–10), then 1 sec intervals (stimuli 11–40).
(G) Zebrafish CaSR protein showing locations of wrong turnp190 and CaSRp198 mutations, Signal Sequence (S, yellow), extracellular Venus Fly Trap domain (VFT, blue), Cysteine-Rich Domain (CRD, pink), 7-pass transmembrane domain (7TMD, orange), C-Terminal Domain (CTD, green), 5 key residues of the ligand-binding pocket of the VFT hinge (light blue), and PKC phosphorylation residue (arrowhead). See also Figure S4.
Error bars indicate SEM, **p<0.01, ****p<0.0001, Bonferroni-corrected t-test.

