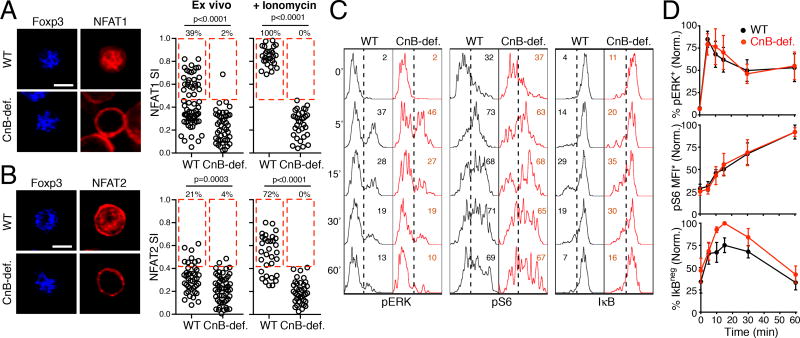
Figure 5. NFAT proteins are the main effectors of CnB activity in Treg.
(A, B) CD4+ CD25+ T cells were purified from LNs and spleens of CnB ΔTreg and Foxp3YFP-Cre control mice and stained for Foxp3 and either NFAT1 (A) or NFAT2 (B) immediately (‘ex vivo’) or after stimulation with ionomycin (‘+ionomycin’). The fraction of nuclear (colocalized with Foxp3) among total cellular NFAT is quantified as the NFAT Signaling Index (SI). Red rectangles highlight cells with SIs above background, whose frequency is shown as percentage. Scale bar = 5 µm. One experiment out of 3 (A) or 2 (B) is shown, p-values calculated through Mann-Whitney U test.(C) Time-course of ERK and S6 phosphorylation and IκB down-regulation in YFP+ WT Treg from CnB ΔTreghet or Foxp3YFP-Cre/wt mice after anti-CD3/CD28 stimulation. Histograms are representative of 4 independent experiments. Gates are set based on fluorescence recorded on unstimulated CD4+ conventional effector T cells with comparable physical characteristics to Treg. Values indicate frequencies of pERK+, pS6+, and IκBneg cells. (D) Comparison of ERK and S6 phosphorylation and IkB down-regulation in YFP+ Treg from CnB ΔTreghet and Foxp3YFP-Cre/wt control mice. Mean and SEM of normalized mean values from 4 independent experiments, each performed in triplicate, are shown. pS6 MFI* indicates frequency of pS6+ cells multiplied with their MFI.

